That's the core problem with how most B2B teams approach win-loss analysis. They're reading seller interpretations of buyer decisions — and those interpretations are wrong more often than not. Corporate Visions' analysis of 150,000 B2B purchase decisions found that sellers and buyers cite different reasons for lost deals 50–70% of the time. Most "win-loss data" is built on guesswork.
A structured, buyer-centric program fixes this. Here's how to build one.
Key Takeaways
- Win-loss analysis collects direct buyer feedback after deals close — going well beyond CRM dropdown codes
- Buyer interviews are more reliable than CRM data; sellers misreport loss reasons more often than not
- A structured win-loss program creates actionable value across sales, product, marketing, and leadership
- Insights only create impact when shared broadly and acted on consistently
- The demo experience ranks among the top win-loss drivers, yet most teams have no systematic process for improving it
What Is Win-Loss Analysis?
Win-loss analysis is a structured research process that captures feedback directly from buyers after a deal closes — won or lost — to uncover the real decision drivers. The key word is buyer. Not a rep's interpretation, and not a CRM note typed in the last 10 minutes before month-end close.
Forrester defines it as "gathering feedback through interviews with recent customers and prospects to understand why business was won, lost, or ended in no decision." That last category is worth paying attention to — Corporate Visions found that 53% of deals marked as lost were actually winnable if not for sales-process missteps.
What Win-Loss Analysis Covers
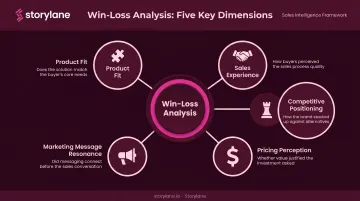
A well-designed program surfaces insights across five dimensions:
- Product fit — which features drove the decision, and what gaps cost the deal
- Sales experience — how buyers perceived the rep, the process, and the engagement quality
- Competitive positioning — how your offering compared to alternatives in the buyer's mind
- Pricing perception — whether price was a genuine objection or a proxy for something else
- Marketing message resonance — whether your positioning matched what buyers actually needed
Interviews vs. Surveys
Two primary methods exist, each with different trade-offs:
| Method | Best For | Depth | Scale |
|---|---|---|---|
| Buyer interviews | Strategic accounts, competitive deals | High | Low |
| Surveys / AI-led feedback | Pipeline-wide trend detection | Moderate | High |
Most mature programs combine both. Interviews surface the "why behind the why." Surveys give you statistical confidence across volume.
Calculating Your Win Rate and Win-Loss Ratio
Both methods only generate value when you have metrics to measure against. Start by establishing two baselines.
Win rate: (Won Deals ÷ Total Closed Opportunities) × 100
This measures overall conversion efficiency — what percentage of pursued deals you actually close.
Win-loss ratio: Won Deals ÷ Lost Deals, expressed as a ratio (e.g., 1:3)
This isolates head-to-head performance. A 1:3 ratio means you win one deal for every three you lose. A weighted, revenue-based win rate adds another layer — it can reveal whether your team is winning small deals but consistently losing large ones, which aggregate percentages obscure.
Why Win-Loss Analysis Is Critical for B2B Sales Teams
The CRM Data Problem
CRM data is structurally unreliable for win-loss insight. Here's why:
- Dropdown reason codes get selected in a rush at deal close
- Sellers often genuinely don't know why they lost — buyers rarely share the real reason
- Data decays quickly; loss codes from 6 months ago reflect memory, not reality
- Crayon's 2025 State of CI report found that **44% of organizations lack CRM visibility** into which deals were even competitive
When 68% of B2B sales opportunities involve a competitor but nearly half of companies can't track which deals those are, the compounding strategic risk is obvious. That blind spot doesn't stay isolated in sales — it ripples across every team that touches revenue.
Cross-Functional Value
Win-loss analysis is not a sales department project. It's a company-wide intelligence program:
- Sales teams surface coaching priorities, objection patterns, and competitive blind spots
- Product teams connect roadmap decisions to real deal outcomes, not just feature requests
- Marketing teams capture the exact language buyers use to evaluate and choose solutions
- Leadership gains the clarity to allocate resources with confidence, not instinct
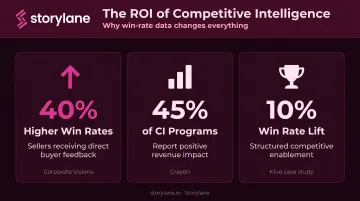
The ROI Case
Corporate Visions reports that sellers receiving direct buyer feedback achieve win rates up to 40% better than those who don't. Crayon found 45% of competitive intelligence programs report a positive impact on company revenue. A Klue case study documented a 10% win rate lift across all product lines from a structured competitive enablement program.
These figures come from different sources and contexts, so no single number applies universally. The pattern they share, though, is consistent: companies that build structured feedback loops from buyers outperform those that rely on seller recall alone.
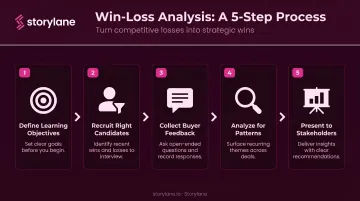
How to Conduct a Win-Loss Analysis: 5 Steps
Most teams fail at win-loss not because they lack data, but because they skip foundational steps. Each step below addresses a common failure point.
Step 1 – Define Your Learning Objectives
Before collecting anything, identify the specific questions you need to answer.
Good examples:
- "Why do we lose to Competitor X in enterprise deals?"
- "Where does our messaging break down with mid-market buyers?"
- "What's causing late-stage drop-off in Q3 pipeline?"
Vague objectives lead to insights that can't drive action. Your objectives should align with company priorities and directly guide which questions you ask buyers.
Step 2 – Identify and Recruit the Right Candidates
Not all deals are equally informative. Prioritize:
- Late-stage deals — these buyers saw everything: your product, your sales process, your pricing, and your competitors
- Competitive losses — highest signal-to-noise ratio for positioning insights
- Deals closed within 90 days — memory degrades fast; Corporate Visions recommends feedback within 30 days of decision when possible
- Balanced mix of wins and losses — wins-only programs create blind spots; losses-only programs miss what's working
Warm introductions from sales reps significantly improve acceptance rates.
Step 3 – Collect Direct Buyer Feedback
Structure your interviews around your learning objectives. Corporate Visions recommends measuring four core dimensions:
- Sales experience
- Product performance
- Company perception
- Price position
Use the "five whys" technique when an answer feels surface-level. "Price was too high" is a starting point, not an answer. Asking why five times often reveals the real driver: implementation anxiety, lack of executive buy-in, or a competitor's better ROI story.
Interviews don't have to cover every deal. AI-led or survey-based collection can surface pipeline-wide patterns without requiring a one-on-one for each closed opportunity.
Step 4 – Analyze for Patterns and Themes
Single-deal anecdotes are interesting. Patterns across 10 deals are actionable.
Tag responses by topic and sub-topic, then look for themes that recur across multiple deals. Common theme categories include:
- Product/feature fit gaps
- Pricing and value perception
- Sales execution quality
- Competitive positioning
- Timing and organizational readiness
One critical warning: confirmation bias is a constant threat. Buyer-reported reasons frequently contradict internal assumptions. That contradiction is the insight — don't smooth it over.
Step 5 – Present Findings to Stakeholders
Win-loss intelligence loses most of its value sitting in a researcher's folder. Three formats work well:
- Deal-level reports — per-interview summaries with direct buyer quotes and stage-by-stage analysis, useful for individual rep coaching
- Executive summaries — cross-functional pattern-level insights tied to strategic priorities, for leadership
- Sales presentations — winning behaviors, common objections, competitive intelligence, ready to use in the field
Findings must reach product, marketing, and leadership — not just sales.
How to Turn Win-Loss Insights into Action
Sales Enablement and Coaching
Win-loss data plugs directly into how you train and equip your sales team. Loss patterns become coaching priorities, winning behaviors get codified into playbooks, and reps stop walking into competitive deals unprepared.
One distinction worth making: battlecards built on actual buyer objections outperform those built on internal assumptions. When a buyer tells you, in their own words, why they chose a competitor, that's the exact language your reps need to counter. Battlecards from internal guesses miss this entirely.
Product and Roadmap Decisions
Win-loss data gives product teams a direct line between feature gaps and revenue impact. The framing matters:
- ❌ "Buyers said they wanted better reporting"
- ✅ "Reporting gaps came up in 40% of competitive losses against Competitor X and were cited as the primary reason for switching"
The second framing makes the revenue cost of inaction concrete, which is what gets features prioritized.
Marketing and Messaging
Win-loss interviews surface the exact language buyers use to describe their problem. For marketing teams, that language is directly usable. It sharpens positioning, focuses campaign targeting, and cuts messaging that resonates internally but falls flat with buyers.
Building a Continuous Feedback Loop
Win-loss is a program, not a project. Teams that run it continuously — rather than reactively after a bad quarter — see compounding improvements. Manual programs can target 8–12 interviews per quarter to start identifying reliable patterns, according to Corporate Visions.
Close the loop explicitly: track which changes were made based on win-loss insights, then measure whether those changes moved outcomes. Without that tracking, win-loss stays informative but never influences decisions.
The Demo Experience: A Win-Loss Driver Teams Often Overlook
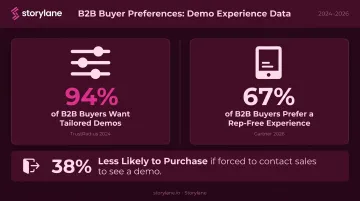
When buyers are asked directly why they chose or rejected a vendor, the demo experience consistently surfaces as a critical factor — often ranking alongside product fit and pricing. Yet most companies don't treat it as a structured win-loss category.
Buyers cite demos that were generic, hard to remember, overly complex, or disconnected from their specific use case as key reasons they disengaged. According to TrustRadius' 2024 B2B Buying Disconnect report, 94% of buyers consider tailored demos important, and 38% are less likely to purchase if they have to contact sales just to see a demo.
Gartner's 2026 survey of 646 B2B buyers adds another dimension: 67% of B2B buyers prefer a rep-free experience, and 64% of buyers familiar with a product prefer a 100% digital buying experience.
Connecting This to the Win-Loss Action Loop
When win-loss interviews reveal that buyers struggled to evaluate your product, arrived unprepared to sales calls, or lost interest in the gap between demo request and live call, interactive demos are a direct corrective action.
Several Storylane customers have addressed this directly. Companies like PaySauce and Trustero identified prospect disengagement between demo requests and live calls as a specific loss driver. Their fix: deploy self-guided interactive demos so prospects experience the product firsthand before the call, arriving engaged and pre-qualified.
Storylane's demo analytics close the loop further. Teams can see exactly where buyers drop off inside a demo:
- Which features held attention and which caused disengagement
- Which accounts are actively re-engaging after going quiet
- How closed-won and closed-lost amounts correlate with demo engagement data
That last point matters for win-loss work specifically. The Deal Intelligence layer gives revenue teams a direct way to tie demo behavior to deal outcomes — turning qualitative interview findings into quantifiable signals.
Personalization matters here too. Dynamic variable tokens let teams create a single base demo that automatically adapts to show prospect-specific names, company data, and use cases — addressing the "generic demo" loss reason at scale without requiring separate demo builds for every account.
The win-loss action loop looks like this:
- Identify a loss driver through buyer interviews
- Design a targeted fix — such as deploying self-guided demos to reduce drop-off
- Measure the impact using demo engagement data tied to deal outcomes
The demo experience is one of the most impactful areas where this loop produces fast, visible results.
Frequently Asked Questions
How to interpret a win-loss ratio?
A win-loss ratio (e.g., 1:3) tells you how many deals you win for every deal you lose. Interpretation requires context — segment, deal size, and competitive dynamics all matter. A lower ratio isn't always bad if you're consistently winning your highest-value accounts.
What is a win-loss strategy?
A win-loss strategy is an ongoing organizational program that systematically collects buyer feedback after deal outcomes, analyzes patterns, and routes insights to sales, marketing, and product teams to improve future win rates. Unlike a one-time audit, it runs continuously as an intelligence function across the business.
What's the difference between win rate and win-loss ratio?
Win rate measures the percentage of all pursued opportunities you close (wins ÷ total opportunities). Win-loss ratio compares wins directly to losses (wins ÷ losses), excluding no-decisions. Both are useful baselines — just measured from different angles.
Why shouldn't sales reps run win-loss analysis themselves?
Sellers frequently misread why deals are lost, and buyers rarely give reps the real reason they didn't buy. A neutral third party — a product marketer, researcher, or dedicated program owner — consistently surfaces more honest, actionable feedback.
How many win-loss interviews should you conduct?
Corporate Visions recommends 8–12 targeted interviews per quarter for manual programs. Quality and candidate selection matter more than raw volume — prioritize late-stage, competitive, or strategically important deals over trying to interview everyone.
What's a good win rate for B2B SaaS?
Win rate benchmarks vary widely by deal size, sales motion, and market maturity. There's no universal target that applies across all B2B SaaS businesses. What matters most is consistent improvement over time, which is exactly what a structured win-loss program is designed to drive.