Introduction
You pull up the pipeline report. Call volume is up. Demos are getting booked. The team looks busy. But revenue targets? Still out of reach.
This is one of the most common disconnects in B2B sales: activity metrics look healthy while close rates quietly erode. When that gap exists and goes unmeasured, the whole operation runs faster in the wrong direction — burning qualified pipeline instead of converting it.
This article covers what sales close rate actually means, how to calculate it correctly, what benchmarks apply to B2B environments (especially SaaS), and specific strategies to move the number. It's written for sales managers, AEs, and SDRs who need a clear formula and a practical improvement plan — not a theoretical overview.
Key Takeaways
- Close rate = Closed Deals ÷ Total Qualified Opportunities × 100 (qualified, not raw leads)
- B2B close rates average 20–30%; B2B SaaS median sits at 19% (The Bridge Group)
- Stage-level tracking pinpoints exactly where deals leak — not just that they do
- Completing MEDDPICC by the Solution Presented stage raises close likelihood by 324%
- Interactive demos and consistent follow-up cadences are two of the highest-leverage improvements
What Is Sales Close Rate?
Sales close rate is the percentage of qualified opportunities that convert into closed deals over a defined period. It measures conversion effectiveness — not how much activity your team produces.
This matters because it's easy to confuse close rate with related terms:
- Close rate: Deals closed ÷ total qualified opportunities in the pipeline
- Win rate: Deals won ÷ all closed deals (won + lost), focusing on competed outcomes
- Conversion rate: A broader term that can apply to any funnel action — MQL to SQL, SQL to opportunity, etc.
These terms are used interchangeably across tools and reports, which creates benchmark confusion. Outreach explicitly distinguishes the two: close rate uses all leads as the denominator, while win rate uses qualified opportunities. HubSpot's own glossary treats them differently as well. Before comparing your number to any benchmark, confirm both figures use the same denominator.
Why does close rate matter as a diagnostic? A consistently low close rate points to a specific breakdown upstream. Weak qualification, a demo that doesn't connect, messaging that misses the buyer's concern — each of these shows up in your close rate before it shows up anywhere else in your pipeline data.
How to Calculate Sales Close Rate
The formula is straightforward:
Close Rate = (Number of Closed Deals ÷ Total Qualified Opportunities) × 100
The denominator is the critical variable. Use qualified opportunities — not raw leads, not all contacts, not every inbound inquiry that ever touched your CRM.
Calculating Close Rate: A Step-by-Step Example
Say a rep enters a quarter with 80 qualified opportunities and closes 20 deals by quarter end.
20 ÷ 80 × 100 = 25%
That's a 25% close rate — a healthy number by most B2B standards.
Now imagine the same rep used total leads (including 200 unqualified contacts) as the denominator:
20 ÷ 200 × 100 = 10%
The rep's performance looks dramatically worse than it actually is. This is the most common calculation error teams make, and it creates two real problems:
- Reps appear underperforming when their numbers are actually solid
- Leaders make pipeline coverage decisions based on a distorted picture
Tracking Close Rate at Each Funnel Stage
A single blended close rate tells you something is wrong. Stage-level tracking tells you where.
Measure conversion at each transition:
| Stage Transition | What Low Conversion Signals |
|---|---|
| Lead → Qualified Opportunity | Weak ICP fit or poor lead source quality |
| Opportunity → Demo | Insufficient urgency or slow follow-up |
| Demo → Proposal | Demo didn't connect to buyer pain |
| Proposal → Closed-Won | Pricing friction, unclear ROI, or late-stage objections |
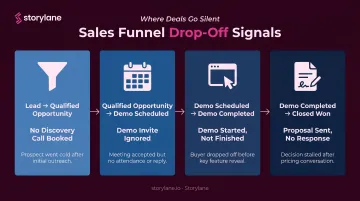
If demo-to-proposal conversion is strong but proposal-to-close is weak, the problem isn't early-stage qualification — it's likely how value is communicated during the pricing conversation. Start there first — it's where most B2B deals quietly stall.
What Is a Good Sales Close Rate?
"Good" depends entirely on context. A 15% close rate might be exceptional for an enterprise SaaS company with 9-month sales cycles and six-figure ACV. The same number would be alarming for a transactional SMB product.
Factors that shape a realistic benchmark:
- Deal size and ACV
- Sales cycle length
- Lead source quality (inbound vs. outbound)
- Number of stakeholders involved
- Market maturity and competitive density
According to HubSpot's 2025 sales statistics, the average sales win rate is 21% and average sales close rate is 29% — which supports the commonly cited 20–30% range. But these numbers blend across contexts, so treat them as a starting point, not a target.
Close Rate Benchmarks by Industry
The most useful benchmarks come from vertical-specific research:
B2B SaaS: The Bridge Group's 2024 SaaS AE Metrics report — covering 172 companies — found a median win rate of 19%, down from 23% in 2022. Win rates decline steadily as deal size grows:
| ACV Band | Median Win Rate |
|---|---|
| Under $5K | 24% |
| $5K–$25K | 20% |
| $25K–$50K | 18% |
| $50K–$100K | 17% |
| Over $100K | 16% |
Professional services and financial services: Direct benchmark data varies significantly by firm type, deal complexity, and relationship-driven versus competitive sales motions. Teams in these verticals are better served building internal benchmarks over 2–3 quarters than relying on cross-industry averages.
Proposal-stage benchmarks: RAIN Group reports an average win rate of 47% for opportunities that reach the proposal stage — but this is not a full-funnel close rate. It only measures deals that already survived earlier stages.
The pattern is consistent: enterprise-focused teams should set internal targets by ACV segment. Benchmarking a $100K+ deal motion against a blended industry average will always make your close rate look worse than it is.
Why Your Close Rate Matters More Than Activity Metrics
High activity with a declining close rate means the team is burning qualified pipeline faster than it converts it. More calls, more emails, more demos — all feeding into a leaky funnel.
The activity trap is real. A rep making 80 calls a week looks productive. But if their close rate has dropped from 25% to 12%, they're creating twice the noise while generating half the output.
That rep-level math scales up fast. Close rate connects directly to revenue forecasting accuracy — when you know your close rate is stable at 22% and you need $500K in new revenue, you can work backwards to determine exactly how much qualified pipeline to build. Without a reliable close rate, quota math becomes guesswork.
For sales leaders, close rate is also the most actionable diagnostic tool available. Segmenting it by:
- Rep — identifies coaching needs and top performers worth studying
- Lead source — reveals which channels actually convert, not just which generate volume
- Deal size — flags whether enterprise deals need different handling than SMB
- Industry vertical — surfaces where messaging resonates and where it doesn't
Ebsta's 2024 B2B Sales Benchmarks report adds a useful data point: opportunities updated weekly are 17% more likely to close, while moving a close date more than three times reduces win rates by 77%. Pipeline hygiene and close rate reinforce each other — treat them as the same problem.
How to Improve Your Sales Close Rate
Tighten Lead Qualification Upfront
Most close rate problems originate at qualification. Allowing weak-fit prospects into the pipeline inflates opportunity counts while dragging conversion down. By the time it shows up in the close rate, the damage is already done — often quarters back.
Structured qualification frameworks address this directly:
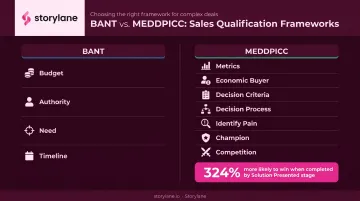
- BANT (Budget, Authority, Need, Timeline) — straightforward entry-level filter for intent and fit
- MEDDIC/MEDDPICC — a more rigorous model that maps economic buyer, decision criteria, decision process, identified pain, and champion
The strongest data point in favor of rigorous qualification: Ebsta's 2024 B2B Sales Benchmarks found that deals where MEDDPICC is completed by the Solution Presented stage are 324% more likely to be won. That's not a marginal improvement — it's a structural one.
Storylane's Account Reveal feature gives SDRs and AEs an additional qualification layer before discovery calls even happen. By surfacing firmographic data when a prospect engages with a shared demo, reps can assess company fit and prioritize outreach based on who's actually exploring the product, not just who submitted a form.
Improve the Quality of the Demo Experience
The product demo is often the highest-leverage moment in a B2B sales cycle, and most teams underperform it.
A generic demo — the same deck, the same flow, the same talking points regardless of who's in the room — fails to connect product capabilities to the buyer's specific situation. The result: polite interest, followed by silence.
What works better: personalized, interactive demos that meet the buyer where they are.
Platforms like Storylane let sales teams build demos that prospects can explore before or during a sales call. Reps can personalize each demo at scale using dynamic tokens — inserting a prospect's company name, logo, revenue figures, or use-case-specific content without rebuilding from scratch each time. A rep duplicates a template, populates the tokens, and sends a tailored experience in minutes.
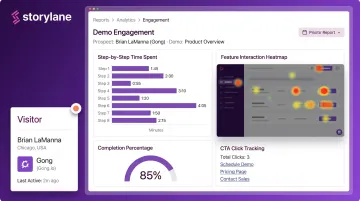
The engagement data these demos generate is where the real signal lives. Storylane's analytics dashboard tracks time spent per step, completion percentage, drop-off points, features explored, and CTA clicks. Real-time Slack alerts notify reps the moment a prospect engages, so follow-up happens at peak buying interest rather than two days later. Reps enter every subsequent conversation already knowing which features resonated and which sections lost attention.
For enterprise deals with multiple stakeholders, multi-chapter demos allow different paths for a CFO versus a VP of Engineering, each seeing the product through the lens most relevant to their decision criteria.
Build Consistent Momentum Between Stages
Most deals don't die from explicit rejection. They die from momentum loss — vague next steps, long gaps between touchpoints, and follow-up that arrives after the buyer's attention has moved elsewhere.
Every interaction should end with two commitments:
- A defined next action with a specific owner
- A scheduled time for it on the calendar
"I'll follow up next week" is not a next step. "Can we put 30 minutes on Thursday at 2pm to walk through the proposal?" is.
Storylane's Buyer Hubs support this between live touchpoints — providing prospects with a centralized location to revisit demos, explore additional use cases, and stay engaged with the product without requiring rep involvement. Private demo links with expiry controls (Whispli's team used one-week windows) add urgency to that self-serve engagement.
Address Objections Earlier in the Cycle
Objections raised at the proposal or pricing stage are far harder to resolve than those surfaced during discovery. By the time a prospect says "the budget isn't there" in week eight, there's no time to build a business case. That same concern, surfaced in week two, is a solvable problem.
Coach reps to proactively surface concerns about budget, timeline, and competing priorities during the first two calls. The goal isn't to disqualify; it's to get ahead of friction before it hardens into a no.
Worth noting on persistence: RAIN Group's research found it takes an average of 8 touchpoints to reach an initial meeting with a new prospect. Structured, multi-touch engagement isn't optional — it's how deals get to the table in the first place.
Use Data to Find and Fix Friction Points
Segment close rate data to identify specific drop-off patterns:
- If inbound leads close at 2× the rate of outbound, that's a signal to revisit outbound qualification criteria — not outbound volume
- If one rep closes 35% while the team average is 18%, study what they're doing differently and replicate it
- If deal size over $50K carries a 12% close rate but under $25K closes at 28%, that's a pricing or ROI communication problem, not a pipeline problem
Align Sales and Marketing on Lead Quality
When marketing optimizes for lead volume and sales optimizes for conversion, the disconnect shows up directly in close rate. Marketing delivers MQLs. Sales finds them unqualified. Blame goes in both directions while the metric deteriorates.
Fix this with shared definitions:
- A single ICP that both teams maintain
- Agreed lead scoring criteria with explicit disqualification rules
- Regular pipeline review cadences where both teams examine what's converting and what isn't
When these are aligned, marketing resources shift toward the channels and segments that actually close — not just the ones that generate clicks.
Common Mistakes When Measuring Close Rate
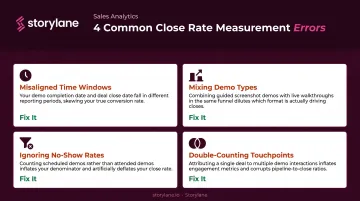
Most close rate errors aren't calculation mistakes — they're structural. Here are the four that distort the metric most:
- Misaligned time windows: Counting only deals closed in Q1 against opportunities created in Q1 skews results when your average cycle runs three months. Use cohort analysis — track every opportunity created in a period through to its outcome, regardless of when it closes.
- Blending without segmenting: A company-wide close rate of 22% hides everything useful — top performers, strong lead sources, winning message patterns, broken segments. The aggregate is a starting point, not an answer.
- Dropping lost deals from the denominator: Some teams calculate close rate using only "active" opportunities, quietly removing anything marked closed-lost. This inflates the number and masks real performance. Include all qualified opportunities with a definitive outcome in the denominator.
- Inconsistent definitions across tools: HubSpot, Gong, and Outreach each define close rate and win rate differently. If your CRM and your sales reporting use different denominators, you'll generate benchmarks you can't compare — internally or externally.
Frequently Asked Questions
What does close rate mean?
Sales close rate is the percentage of qualified opportunities that result in a closed deal within a defined period. It measures how effectively a sales team converts active pipeline into revenue, not how much activity the team produces.
How do I calculate close rate?
Use this formula: Closed Deals ÷ Total Qualified Opportunities × 100. For example, 20 closed deals from 80 qualified opportunities equals a 25% close rate. Always use qualified opportunities — not raw leads — as the denominator.
What is a good close rate?
Most B2B teams target a 20–30% close rate as a healthy baseline. B2B SaaS teams average closer to 19% (Bridge Group, 2024). The right benchmark depends on deal size, sales cycle length, and whether you're selling into SMB or enterprise.
What is the difference between close rate and win rate?
Close rate measures conversion across all qualified opportunities in the pipeline. Win rate typically focuses on the percentage of competed deals — those that reached a final decision — that ended as closed-won versus closed-lost. The denominators differ, so the numbers aren't directly comparable.
What factors most affect sales close rate?
The main drivers include:
- Lead quality and qualification rigor
- Demo and discovery effectiveness
- Follow-up consistency
- How well messaging maps to buyer pain points
- Pipeline hygiene — stage discipline and regular CRM updates
How do you track close rate over time?
Measure on a consistent cadence — monthly or quarterly — and segment by rep, lead source, and deal size. Look for trends across multiple periods rather than reacting to single-quarter swings. Three consecutive quarters of decline is a signal worth acting on; one bad quarter rarely is.