The math is straightforward: doubling your conversion rate from 1% to 2% delivers the same pipeline growth as doubling your traffic budget. One of those is significantly cheaper.
This guide covers what B2B CRO actually requires in 2026: how it differs from B2C, where benchmarks are useful (and where they mislead), the metrics that connect optimization work to revenue, and the strategies that drive pipeline rather than just form fills. It also covers why interactive experiences have become one of the highest-leverage tools in the modern B2B conversion stack.
Key Takeaways
- B2B CRO targets buying committees, not individual users, which reshapes every optimization decision from copy to conversion flow
- Benchmark data varies widely by industry, channel, and conversion action; your own baseline matters more than industry averages
- Lead-to-opportunity rate and MQL-to-SQL rate are more meaningful than raw form fill volume
- Highest-ROI levers in 2026: funnel-stage personalization, friction reduction, and matching content to buyer role
- Interactive demos move prospects from curiosity to sales-ready intent faster than static content — without adding friction
What Makes B2B CRO Different From B2C
The Multi-Stakeholder Reality
B2B purchases don't have one decision-maker. According to Forrester's State of Business Buying 2024, the average B2B purchase involves 13 people, with 89% spanning two or more departments. Gartner adds that buying groups can include up to 16 individuals across four functions — and 74% of those teams experience conflict during the decision process.
This fundamentally changes what "conversion" means. A single session that ends in a form fill may represent one stakeholder's action, not a buying committee's decision. Optimizing for that moment in isolation misses most of what drives deals forward.
B2B technology purchases typically run six months (longer for large deals), and many conversion moments happen in channels and conversations that session-level analytics never capture.
Intent and Volume Look Different
B2C CRO chases volume and immediacy. A higher click-through rate almost always means more revenue. B2B doesn't work that way.
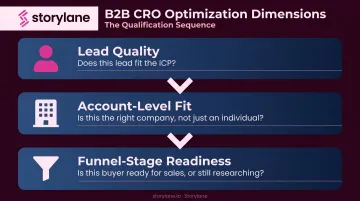
A high-volume, low-intent lead flow actively damages sales efficiency. It floods pipelines with contacts that won't close, degrades forecast accuracy, and wastes rep capacity. B2B CRO must optimize for:
- Lead quality — does this lead fit the ICP?
- Account-level fit — is this the right company, not just an interested individual?
- Funnel-stage readiness — is this buyer ready for a sales conversation, or still researching?
Account-Level vs. User-Level Thinking
In B2B, the company is the unit of conversion. Multiple individuals from the same account (a product manager, a finance lead, an IT evaluator) may touch your content across different channels over weeks before a deal progresses. User-level tracking loses this picture entirely.
Effective B2B CRO requires account-level tracking that connects those individual touchpoints into a single buying journey. That means:
- Stitching sessions by account, not just by cookie or user ID
- Mapping content engagement across roles and stages
- Identifying buying committee momentum, not just individual interest
B2B Conversion Rate Benchmarks for 2026
What the Numbers Actually Show
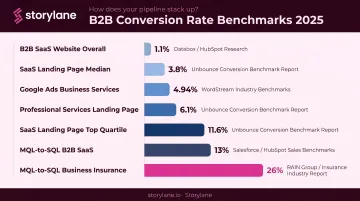
There is no single "B2B conversion rate." What you're measuring, which channel drove the traffic, and which industry you're in all shape it differently. Current benchmark data illustrates the range:
| Segment | Benchmark | Source |
|---|---|---|
| SaaS landing page (median) | 3.8% | Unbounce 2024, 41K+ pages |
| SaaS landing page (top quartile) | 11.6% | Unbounce 2025 |
| Professional services landing page | 6.1% | Unbounce 2025 |
| Google Ads – Business Services | 4.94% | WordStream 2023 |
| B2B SaaS website (overall) | 1.1% | First Page Sage (agency data) |
| MQL-to-SQL – B2B SaaS | 13% | First Page Sage (agency data) |
| MQL-to-SQL – Business Insurance | 26% | First Page Sage (agency data) |
A SaaS website converting at 1.1% overall and a SaaS landing page converting at 3.8% aren't contradictory — they're measuring different things. A paid search landing page for a SaaS product will convert differently than the homepage, a pricing page, or a blog post.
"Conversion Rate" Is Not One Metric
Before benchmarking anything, define which conversion you're measuring:
- A landing page form fill
- A demo request
- An MQL-to-SQL handoff
- A trial activation
- A closed deal
Each has its own benchmarks, optimization levers, and pipeline implications. Teams that skip this definition end up benchmarking the wrong thing entirely.
Your Baseline Beats Industry Averages
Forrester's multi-touch attribution guidance makes a relevant point: attribution models estimate relative performance, not precise returns. The same logic applies to benchmarks — they're directional signals, not performance targets.
Start by segmenting your own baseline across traffic source, funnel stage, and audience type. A 20% lift on your current paid search conversion rate matters more than hitting an industry average built on a different product, price point, or buying motion.
B2B CRO Metrics That Actually Matter
Ditch the Vanity Metrics
Raw form fills and total visits tell you almost nothing about pipeline health. The metrics that matter connect optimization work to revenue outcomes:
- Lead-to-opportunity conversion rate (what percentage of leads become genuine sales opportunities)
- MQL-to-SQL rate (are marketing-qualified leads actually sales-ready?) Industry data shows this ranges from 10% to 26% depending on vertical
- Funnel stage velocity (how long accounts spend at each stage before progressing)
- Content-influenced pipeline (which touchpoints correlate with deal progression)
Storylane's platform surfaces one concrete example of what pipeline-tied measurement looks like: ContactMonkey tracked a 28% demo-to-opportunity conversion rate — double their other inbound sources — and attributed $1.3M in pipeline directly to interactive demo engagement.
Multi-Touch Attribution in Long Sales Cycles
Single-touch attribution (first touch or last touch) misattributes credit in B2B. A prospect who downloads a whitepaper, attends a webinar, reads three case studies, and then requests a demo didn't convert because of the demo request form alone.
Multi-touch models reveal which content and touchpoints actually move accounts forward. Forrester notes that no single model answers every question perfectly — the goal is directional clarity, not mathematical precision.
In practice, that means using multi-touch data to identify which optimization efforts correlate with pipeline progression, then prioritizing experiments that affect those touchpoints.
North Star Metrics Beyond Conversion Rate
Connect CRO work to these revenue-linked measures:
- Sales cycle length (track whether optimizations compress time-to-close)
- Time to first meaningful action (demo request, trial start, content download)
- Average deal size (higher-intent leads should also be higher-value)
- Customer acquisition cost payback period (better conversion efficiency should lower CAC)
B2B CRO Strategies That Drive Pipeline in 2026
Build Dedicated Landing Pages, Not Homepage Funnels
Homepages serve too many audiences to convert any of them well. Every campaign, audience segment, and offer deserves its own landing page with messaging that matches the specific context driving that traffic.
A paid search visitor searching for "enterprise security software" and an outbound email recipient who works at a 500-person fintech company have different concerns. One page can't address both effectively.
Funnel-Stage Specific Optimization
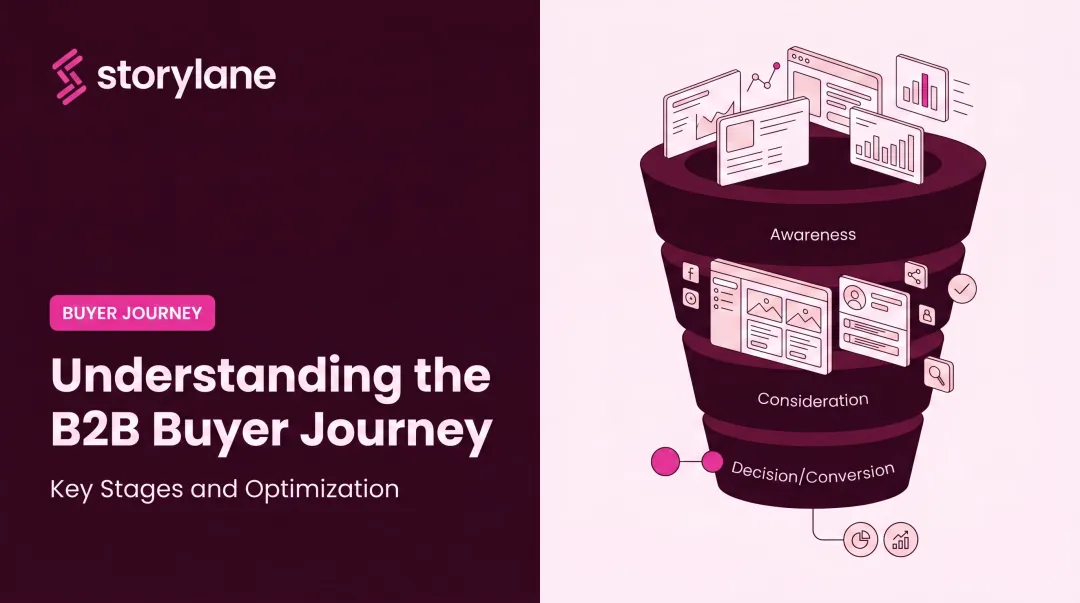
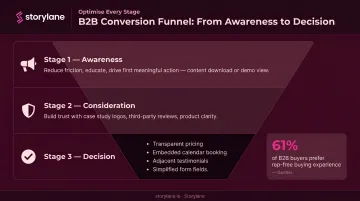
CRO strategy must change based on where the buyer is:
Awareness stage: Reduce friction, educate, avoid asking for too much too soon. The goal is a first meaningful action — content download, newsletter signup, demo view.
Consideration stage: Build trust. Case study logos, third-party reviews, product clarity. Buyers are evaluating alternatives; your job is to demonstrate fit.
Decision stage: Eliminate objections and simplify the path to action. Specific tactics that work:
- Transparent pricing signals (even ranges) reduce uncertainty
- Embedded calendar booking replaces static forms that add delay
- Testimonials and case study logos positioned directly adjacent to CTAs
- Simplified form fields — research from Gartner shows 61% of B2B buyers prefer a rep-free buying experience, meaning friction at the decision stage directly costs pipeline
Personalization Using Firmographic and Behavioral Signals
Firmographic data (company size, industry, role) and behavioral signals (pages visited, content consumed, return visits) enable messaging that speaks directly to a prospect's context. This approach is especially powerful for ABM campaigns targeting named accounts.
Storylane's dynamic token system illustrates how this works at scale. Teams build a single master demo, then inject variables — {{company_name}}, {{logo}}, revenue data, industry-specific messaging — that resolve automatically when a specific account accesses their personalized link. No manual rebuild per account; the same principle applies to landing pages and email sequences.
For ABM specifically, account-specific case studies, role-tailored CTAs, and persona-specific demo paths all increase relevance without requiring custom builds for every visitor.
Simplifying the Buying Journey
Every additional step, form field, or decision point is a potential drop-off. The principle: collect only what you need, when you need it. Progressive disclosure (gathering information across multiple interactions rather than all upfront) reduces abandonment while still building a complete prospect profile over time.
Self-serve expectations have reshaped B2B buyer behavior. TrustRadius research found:
- Virtually 100% of B2B buyers want to self-serve at least part of the journey
- Free trials influenced 77% of buyers (up from 67% the prior year)
- 38% are less likely to buy if forced to contact sales for a demo or trial
Enabling self-service discovery at the consideration stage shortens sales cycles and improves lead quality. Buyers who self-educate before a sales call arrive with sharper questions and clearer intent.
A/B Testing Tied to Pipeline Outcomes
The experiments worth running in B2B CRO are the ones tied to pipeline creation — not just click-through rates. Use a prioritization framework — ICE (Impact, Confidence, Effort) works well — to rank your experiment backlog and tie each test hypothesis to a revenue-linked KPI.
In long sales cycles, early and mid-funnel tests are more practical:
- Headline framing on landing pages
- CTA language on demo request pages
- Social proof placement relative to conversion actions
- Demo request flow steps and form fields
One practical constraint: low-traffic B2B sites often can't reach statistical significance on conventional A/B tests in reasonable timeframes. Some B2B contexts may require 10,000+ visitors per variation for reliable results. When traffic is limited, test higher-impact page elements first, and consider using account-based segmentation to track engagement trends rather than waiting for individual conversion data to accumulate.
How Interactive Demos Accelerate B2B Conversions
The Self-Directed Research Gap
B2B buyers conduct significant research before engaging with sales. According to 6sense's 2025 B2B Buyer Experience Report, buyers now reach out to sellers at 61% of the way through their buying journey — down from 69% in 2023-2024. 94% of buying groups rank their shortlist before any live vendor contact, and the first vendor contacted wins 80% of deals.
Product pages, PDFs, and one-pagers don't move buyers off the fence. Buyers want to experience what a product does, not read about it. The conversion gap between interest and action exists because there's nothing between "content consumption" and "request a demo call."
What Interactive Demos Do to Conversion Mechanics
Embedding a self-guided product walkthrough on a landing page, pricing page, or in an outbound email sequence lets prospects experience the product's value before a sales conversation. The result: inbound demo requests arrive with higher intent and clearer qualification.
The outcome data from Storylane's platform supports this. Prospects who engaged with interactive demos converted at a deal conversion rate of 10.1% — 3.2x higher than the 3.1% average among prospects who didn't engage. Respond.io saw a 162% increase in trial clicks after deploying Storylane demos.
The quality of what converts matters as much as the volume. A prospect who has already explored your product's core workflow arrives at a sales call with specific questions and a baseline understanding, compressing the early discovery stages and moving the conversation forward faster.
Demo Analytics as CRO Intelligence
Interactive demos generate engagement data that static content never could. Storylane's analytics track:
- Completion rates and time-on-step — where do prospects engage deeply, and where do they drop off?
- Feature-level exploration — which capabilities get attention from which company types?
- Intent scoring — automatically classified as Low, Medium, or High based on time spent, completion, return visits, and CTA clicks
- Account Reveal — de-anonymizes visitors with firmographic data (company name, location, revenue indicators) even without a form fill
Account Reveal matters for CRO specifically. Ungated demos receive more than 2x the engagement of gated demos (19.4% vs. 9.2% average engagement rate), but traditionally made attribution difficult. Account Reveal closes that gap — teams get identity and firmographic context without adding friction to the demo experience.
Sales teams receive real-time Slack alerts when high-intent accounts engage, with full engagement context synced to Salesforce, HubSpot, or Marketo. That's a direct signal from demo engagement to CRM-informed follow-up.
Supporting Multi-Stakeholder Buying
Champions — the internal advocates who drive a purchase forward — face a real problem: how do they share product context with procurement, finance, and technical evaluators who weren't in the original discovery call?
A shareable demo hub gives champions something concrete to distribute internally. Different buying committee members can explore role-specific demo paths at their own pace, without requiring additional sales calls.
Storylane's platform tracks which stakeholders engage and which features they explore, then flags when buying committee members become active — giving sales teams direct visibility into buying committee dynamics that would otherwise go undetected.
Common B2B CRO Mistakes That Limit Growth
Optimizing for MQL Volume Over Lead Quality
When CRO efforts inflate top-of-funnel volume without improving quality, sales efficiency drops. MQL-to-SQL benchmarks show that quality varies sharply by vertical — 13% for SaaS, 26% for business insurance. Teams chasing raw MQL volume often drag these rates down, flooding sales with low-fit contacts that consume capacity without closing.
The fix: optimize for lead-to-opportunity conversion rate, not form fills. Define what a quality lead looks like in ICP terms before building conversion experiments around generating more of them.
Treating CRO as a Design Problem
Button colors and layout tests rarely move the needle on their own. CRO is a messaging and targeting problem before it's a design problem.
If the wrong audience is landing on the page, or the offer doesn't match their stage in the buying journey, no visual tweak will fix it. Get these right first:
- Messaging relevance — does the copy speak to this audience's specific pain?
- Offer clarity — is it obvious what the visitor gets and why it matters?
- Audience targeting — are the right people landing on the page at all?
Then optimize the experience around a page that's already converting for the right reasons.
Running Underpowered Tests Without Clear Hypotheses
A test without a hypothesis is a guess dressed up as an experiment. Before any test launches, the team should agree on:
- What specific change is being tested
- What metric constitutes success
- What sample size is required for the result to be statistically meaningful
In B2B, low-traffic environments can make reaching 95%+ statistical confidence impractical in any reasonable timeframe. Running tests that end prematurely produces misleading results that send optimization efforts in the wrong direction.
Marketing, sales, and analytics teams should align on experiment design before launch — not after results come in.
Frequently Asked Questions
What is a good conversion rate for B2B?
There's no universal answer. Current benchmarks range from 1.1% for B2B SaaS websites overall to 3.8% for SaaS landing pages and 6.1% for professional services landing pages (Unbounce 2024/2025). Top-quartile SaaS landing pages hit 11.6%. "Good" depends on your industry, traffic source, and which conversion action you're measuring.
What is the 95/5 rule for B2B marketing?
Attributed to Professor John Dawes of the Ehrenberg-Bass Institute, the rule states that only about 5% of B2B buyers are actively in-market at any given time. For CRO, this means optimization should also build familiarity with the 95% who aren't ready yet, so they convert once they do enter the market.
How does B2B CRO differ from B2C CRO?
B2B CRO deals with longer sales cycles, multiple decision-makers, and account-level (not user-level) conversion tracking. The goal is pipeline quality over volume. B2C CRO typically optimizes for individual, high-frequency, lower-value transactions where volume and immediacy are the primary levers.
What is the most important B2B CRO metric beyond conversion rate?
Lead-to-opportunity conversion rate or MQL-to-SQL rate. These connect marketing optimization work directly to sales outcomes rather than measuring top-of-funnel activity in isolation. A high form fill rate with a low MQL-to-SQL rate signals a quality problem, not a volume success.
How do you run CRO tests when the B2B sales cycle is months long?
Focus tests on early and mid-funnel actions — demo requests, content downloads, trial activations — that correlate with future pipeline. Use account-based segmentation to track engagement trends rather than waiting for deal closure to validate results. Test headline framing, CTA language, and social proof placement before testing anything that requires full-cycle data.
How can interactive demos improve B2B conversion rates?
Interactive demos let prospects self-qualify and experience product value before talking to sales. Storylane's platform data shows demo-engaged prospects convert at 3.2x the rate of those who don't interact with a demo, improving both conversion rate and lead quality at once.