Meanwhile, B2B sales cycles have been getting structurally longer. Analysis of 4.2 million opportunities by Ebsta and Pavilion found cycles were 38% longer in 2023 than in 2021, with 44% of deals slipping and win rates for deals stalled over eight weeks dropping by 67%. Bigger buying committees, tighter CFO scrutiny, and more self-educated buyers have all compounded the problem.
This article covers how to measure sales cycle length correctly, what benchmarks actually mean, the factors driving longer cycles, and proven tactics to compress time-to-close without rushing buyers.
Key Takeaways
- Sales cycle length = total days from opportunity creation to closed-won ÷ total deals closed — how you define the start point changes your number
- Blended averages mislead — segment by deal size, stage, and rep to find where cycles actually break down
- Buying committees, tighter budget scrutiny, and pre-contact self-education are the main forces extending cycles today
- Compress cycles by front-loading discovery, multi-threading early, and reducing procurement friction
- Shorter cycles directly improve pipeline velocity and forecast accuracy
How to Measure Sales Cycle Length
Accurate measurement requires more than a formula. It requires deliberate decisions about where the clock starts, how data is segmented, and how stage-level breakdowns reveal bottlenecks that averages hide.
Step 1: Define Your Start and End Points
Where you start the clock changes the metric fundamentally. Teams that start at first contact capture the full marketing-to-close timeline. Teams that start at opportunity creation — meaning a qualified deal has entered active pipeline after discovery — measure the selling process specifically.
Recommendation: Start at opportunity creation. This gives you a metric you can actually improve through sales process changes.
The end point is always closed-won. Excluding lost deals from the calculation skews your average. Track them separately to understand how stalled deals compare to won deals.
Step 2: Calculate Your Average Cycle Length
The formula is straightforward:
Total days to close across all closed-won deals ÷ number of deals closed = average cycle length
Example: Four deals closed in 40, 60, 80, and 100 days → 280 ÷ 4 = 70-day average.
For measurement period, a rolling 90-day window tends to be more stable and actionable than monthly snapshots (too noisy) or annual averages (too slow to reflect process changes).
Step 3: Segment by Deal Size and Rep
The blended average is where analysis ends for most teams. That's the mistake.
Break it down by:
- Deal size tier — SMB, mid-market, and enterprise have structurally different cycle lengths; blending them produces a number that describes none of them
- Rep-level — a rep with a consistently longer cycle than peers in the same segment almost always has a specific stage where momentum stalls
Ebsta/Pavilion benchmark data puts this in sharp relief: top-performing reps generated 81% of total revenue and showed an 8.9x velocity delta versus average peers. Rep-level segmentation turns coaching conversations from vague to specific.
Step 4: Analyze Time-in-Stage to Find Bottlenecks
Pull closed-won deals from your CRM and calculate average days spent in each stage: Discovery, Demo/Solution, Proposal, Negotiation, and Close.
Two findings from the Ebsta/Pavilion research are useful here:
- When the Qualification stage runs 50% longer than historical average, a deal is 120% more likely to slip
- Deals that skipped a stage were 46% less likely to close
This stage-level view tells you exactly where to focus compression efforts. Once you know which stage is stalling, you can target it directly — which is what the next section covers.
Sales Cycle Length Benchmarks
Benchmarks are a reference point, not a target. The number that matters most is your own trailing average by segment. But knowing where you stand relative to industry norms helps identify whether you have a process problem or simply a deal-mix reality.
B2B SaaS Benchmarks by Deal Size
The table below draws on Optifai's B2B SaaS cycle benchmarks (published 2026, reflecting current market conditions) and TrustRadius B2B technology buyer data from 2,058 technology buyers.
| Segment | ACV Range | Typical Cycle Length | Trend Since 2022 |
|---|---|---|---|
| SMB | Under $15K | 14–30 days | Stable |
| Mid-Market | $15K–$100K | 30–90 days | Lengthening |
| Enterprise | Above $100K | 90–180+ days | Lengthening |
| B2B tech average | All sizes | ~3.8 months | Up ~22% |
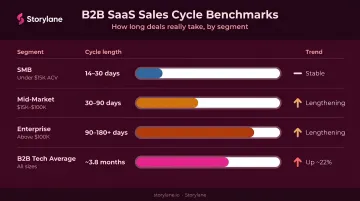
Enterprise deals at $100K+ averaged 6.6 months according to the TrustRadius buyer survey. Multi-stakeholder approval chains and procurement governance make that timeline structural, not a sign of a broken sales process.
Industry Considerations
Deal complexity doesn't stop at company size — industry adds its own weight. Regulated industries run longer, and the gap compounds the further you move up-market. Any product requiring security review, HIPAA assessment, or compliance sign-off adds procurement layers that horizontal SaaS simply doesn't face.
Key Factors That Affect Sales Cycle Length
Cycle length is an output. It reflects a set of controllable and structural variables. Understanding which factors are driving length in your pipeline is the prerequisite to shortening it.
Buying Committee Size and Stakeholder Alignment
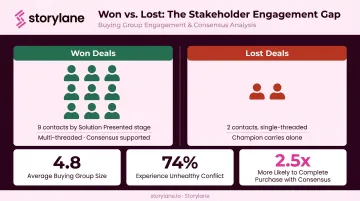
TrustRadius's 2025 buyer research found buying groups average 4.8 people, with 66% involving VP- or C-level executives. A separate Gartner survey found that 74% of B2B buyer teams experience unhealthy conflict during the decision process — and consensus-reaching groups were 2.5x more likely to complete a high-quality purchase.
Each additional stakeholder doesn't add a fixed number of days. It adds coordination overhead that compounds across every stage. Single-threaded deals — where one champion carries internal consensus-building alone — stall predictably. The Ebsta/Pavilion data makes the contrast stark: won deals involved an average of 9 contacts by the Solution Presented stage, compared to just 2 contacts for lost deals.
Product Education Gap at First Contact
When prospects arrive at the first sales call without understanding what the product does, early stages get consumed by basic education rather than qualification. The conversation stays shallow, demos get delayed, and unqualified deals drift forward instead of washing out.
Interactive product demos shift this dynamic. Tools like Storylane let prospects self-explore the product before the first call — buyers arrive pre-educated, qualification happens faster, and unfit leads self-select out earlier.
Campminder's sales team describes the effect directly: after sending interactive walkthroughs pre-call, they "skip over the discovery, and jump straight into a high-intent demo — time saved for buyers and sellers."
Budget Scrutiny and Approval Layers
Post-2022 CFO-driven budget discipline has added procurement, security assessment, and multi-level approval steps to deals that previously closed on VP discretion.
The numbers reflect the shift:
- 87% of buyers adjusted their processes to focus on mission-critical ROI, per the TrustRadius 2024 B2B Buying Disconnect report
- 59% of lost deals were attributed to budget by vendors in the same study
- AI products took 21% longer to buy than comparable non-AI SaaS in Q2 2024, per Vendr's purchasing data
This scrutiny is most visible in the Negotiation and Procurement stages — exactly where deals "go quiet" for weeks while moving through internal processes the rep cannot see.
How to Shorten Your Sales Cycle
Cycle compression is not about rushing buyers. It's about removing friction, improving information quality early, and supporting the buyer's internal process rather than leaving it to chance.
Front-Load Discovery to Eliminate Late-Stage Surprises
Most teams treat discovery as pain-point gathering. Budget, timeline, decision process, and competitive landscape emerge piecemeal over weeks — which means proposals go out before the rep understands the approval process, and business cases get built reactively.
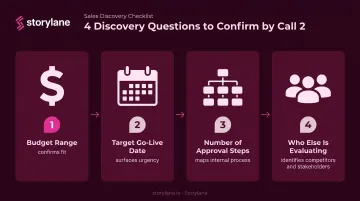
Get all four confirmed by the second call:
- Budget range — a ballpark that confirms fit, not a precise number
- Target go-live date — surfaces urgency and timeline pressure
- Number of approval steps — maps the internal process before it becomes a surprise at Stage 4
- Who else is evaluating — identifies competitors and additional stakeholders
The Ebsta/Pavilion data supports the urgency here: top performers were 366% more likely to close or disqualify an opportunity at Discovery, and qualification stages running 50% over historical average made slippage 120% more likely.
Multi-Thread the Buying Committee Before Stage 3
After every discovery call, ask one question: "Who else needs to be part of this decision?" Then schedule direct touchpoints with each stakeholder within 10 days — don't leave it to the champion.
Gong's analysis of 1.8 million new business opportunities found multi-threading boosts win rates by an average of 130% for deals over $50K. Top reps were 489% more likely to engage the Economic Buyer before Solution Presented.
Single-threaded deals don't just lose — they stall. When a champion needs to build internal consensus alone, without vendor support or materials, deals go quiet for weeks. Multi-threading doesn't just improve win rates; it keeps deals moving.
Use Interactive Demos to Pre-Qualify and Accelerate Evaluation
Sending a self-guided product demo before the live demo call compresses the evaluation stage. Buyers arrive having already explored core features, which reduces the number of "show me how it works" sessions needed before a proposal.
Storylane's demo engagement analytics add a second layer of value: reps receive Slack alerts when prospects engage, along with data on time spent, completion percentage, and which sections prompted the most engagement.
That intelligence lets reps enter the live call already knowing what the buyer cares about, rather than spending the first 20 minutes figuring it out.
BigTeams reported a 3x increase in sales velocity and 5x increase in leads after implementing Storylane's interactive product tours, crediting the platform with enabling "better lead qualification, contextual live demos, and fewer back and forths on product queries."
Quantify the Business Case During the Solution Stage
Deals stall at procurement when the champion walks in without a quantified ROI justification. Build the business case with the champion during the solution stage before procurement ever asks for it.
Three components to cover:
- Cost of current state — what is the problem costing them in time, headcount, or revenue today?
- Value of proposed solution — expressed in the same units (hours saved, deals closed, errors reduced)
- Payback period — how quickly does the investment return itself?
A champion who walks into procurement with these numbers prepared is a champion who can close internally. One who doesn't will stall there for weeks.
Build a Procurement Acceleration Package
For enterprise deals, send a package at Stage 3 — before the prospect asks — containing:
- Security questionnaire answers
- SOC 2 report
- Data processing agreement (DPA)
- MSA template
- Reference contacts in the same industry
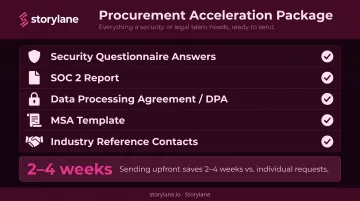
The back-and-forth of individual document requests can add 2–4 weeks to an enterprise close. Sending everything upfront turns a month-long paper chase into a single email.
Common Mistakes That Lengthen Your Sales Cycle
Tracking Only the Blended Average
When SMB and enterprise deals are averaged together, neither segment is accurately represented. The number is too noisy to act on and too broad to diagnose. Segment by deal size and stage from the start — blended averages belong in board decks, not pipeline reviews.
Letting Deals Go Single-Threaded
The pattern is consistent: a rep builds rapport with one champion, avoids the awkwardness of asking for introductions, then watches the deal stall for three to six weeks when the champion needs to sell internally. Multi-threading feels uncomfortable early — but watching a deal go dark for a month is worse. Map the buying committee within the first two calls and ask for introductions before you need them.
Skipping Business Case Quantification Until Late in the Cycle
When the business case is built reactively — only after procurement requests justification — the champion walks into an internal meeting unprepared. That adds 2–4 weeks minimum and often triggers a second round of presentations. Build it proactively during the solution stage, and your champion walks in ready to close internally instead of scrambling to justify the spend.
Frequently Asked Questions
How long is a typical sales cycle?
B2B sales cycle length varies significantly by deal size. SMB deals under $15K ACV typically close in 14–30 days, mid-market in 30–90 days, and enterprise deals above $100K in 3–6 months or longer. Cycles have been trending longer since 2022 across all segments.
What are the 7 stages of the sales cycle?
The seven stages are: prospecting, preparation and research, initial outreach, needs discovery, product presentation and demo, handling objections, and closing. Some teams add onboarding as an eighth stage, particularly in SaaS.
What are the 3-3-3 and 30-60-90 rules in sales?
The 3-3-3 rule is an early outreach cadence — contact a prospect 3 times over 3 days via 3 different channels, not a cycle length benchmark. The 30-60-90 rule is a structured ramp plan for new reps with defined milestones at each 30-day interval, also an engagement framework rather than a timing standard.
What is a good sales cycle length for B2B SaaS?
The most useful benchmark is your own trailing 90-day average by deal tier, compared against industry norms for your segment. If your cycle consistently runs longer than the top quarter of peers at the same deal size, that's the trigger to audit each stage for where time is being lost.
How does sales cycle length affect revenue forecasting?
Cycle length is the denominator in pipeline velocity. Inaccurate cycle assumptions cause deals to appear in the wrong forecast period. Forecast models that use blended averages instead of segment-level data will consistently overstate how much pipeline closes in any given quarter.
How do you find where your sales cycle is slowest?
Pull closed-won deals from your CRM and calculate average days per stage — Discovery, Demo, Proposal, Negotiation, Close. The stage with the largest share of total cycle time is where compression efforts will have the most impact.