Introduction
Most sales organizations know their forecasts are wrong. What they underestimate is how wrong — and how damaging that gap becomes downstream.
According to a 2024 Gong/Censuswide survey of more than 2,000 business leaders, 81% of companies missed their sales forecast for at least one quarter across a seven-quarter period. Among US respondents, the fallout was immediate: 42% reported hiring freezes, 40% paused planned compensation increases, and 28% let people go.
This isn't just a sales problem. A single bad forecast ripples outward: finance revises headcount plans, operations scrambles on inventory, and leadership faces uncomfortable conversations with investors.
This guide is built for revenue and sales leaders who want forecasts that actually hold up — covering the core methods, a practical build process, and the common breakdowns that quietly erode accuracy over time.
Key Takeaways
- 81% of companies missed at least one forecast over a seven-quarter period — the cost extends well beyond missed quota.
- Accurate forecasting requires clean CRM data, standardized pipeline definitions, and cross-functional alignment.
- Combine quantitative methods (pipeline coverage, historical trends) with qualitative rep estimates for more reliable forecasts.
- Buyer engagement signals are stronger pipeline confidence indicators than close dates alone.
- Three forecast scenarios — conservative, base, optimistic — should be standard practice.
What Is Sales Forecasting and Why Does It Matter?
Sales forecasting is the structured process of estimating future revenue over a defined period — weekly, monthly, quarterly, or annually — by analyzing pipeline data, historical performance, and market conditions. Unlike general financial forecasting, which spans the entire P&L, sales forecasting focuses specifically on what the sales organization expects to close.
Sales forecasts are operational tools, not just financial projections. Finance uses them to set budgets and headcount plans; operations relies on them for inventory and capacity decisions; leadership uses them to set investor expectations. When one forecast goes sideways, every downstream plan follows.
Consider a practical example: a SaaS company forecasts $8M in Q3 ARR. Based on that number, they approve two new engineering hires, commit to a conference sponsorship, and signal confidence to their board.
The actual result comes in at $5.5M. Now they're overextended on headcount, have spent the marketing budget, and face a credibility problem with investors — none of which was caused by a sales execution failure alone.
Who Uses Sales Forecasts?
In most B2B organizations, sales forecasting is a cross-functional responsibility — not a task owned by sales alone:
- Sales ops builds and maintains the forecast model, manages stage definitions, and owns pipeline hygiene
- Finance validates underlying assumptions and stress-tests projections
- Marketing uses forecasts to align demand generation spend and pipeline coverage targets
- HR depends on revenue forecasts to time recruiting cycles and headcount approvals
A 2024 Xactly benchmark report found that 97% of leaders agreed Sales and Finance teams need to work better together for accurate forecasting — yet 30% of forecast misses were attributed directly to a lack of collaboration between RevOps, Finance, and GTM teams.
Benefits of Accurate Sales Forecasting
When forecasts are reliable, the benefits compound across the business:
- Proactive resource allocation — headcount, tooling, and budget decisions are made ahead of need, not in response to shortfall
- Realistic quota-setting — targets reflect actual pipeline capacity rather than aspirational numbers from the top down
- Early deal risk identification — weak pipeline coverage becomes visible before the quarter ends
- Stronger board and investor credibility — leaders who consistently deliver accurate forecasts build long-term trust
- Better cash flow management — finance can plan disbursements and reserves with more precision
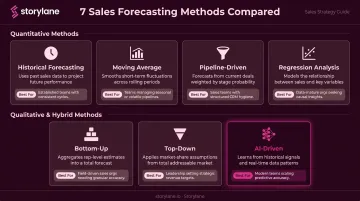
Sales Forecasting Methods: Quantitative and Qualitative
No single method works for every business. The right approach depends on how much historical data you have, how complex your sales cycle is, and how mature your CRM tracking is. Methods generally fall into two categories: quantitative (data-driven and statistical) and qualitative (judgment-based or hybrid).
Quantitative Forecasting Methods
Historical forecasting uses the same period from a prior year as the baseline projection. It works well for stable businesses with predictable cycles — a company with consistent 15% year-over-year growth can apply that rate with confidence. It breaks down quickly during rapid growth, market disruption, or product transitions where the past is a poor proxy for what's ahead.
Moving average smooths out single-period anomalies by averaging sales across a set number of recent periods (typically three to six months). This is most useful for businesses with seasonal or cyclical patterns where one abnormal month would otherwise skew the whole projection.
Pipeline (lead-driven) forecasting multiplies open opportunities by historical conversion rates and average deal size, weighted by deal stage. It's the standard approach for B2B SaaS companies with a well-tracked CRM and defined sales stages — the more granular and clean the pipeline data, the more reliable this method becomes.
Regression analysis identifies the statistical relationship between sales outcomes and specific driving variables — marketing spend, sales headcount, economic indicators, or web traffic. It's most useful when certain inputs consistently and measurably predict revenue, and is typically the domain of more analytically mature teams.
Qualitative and Hybrid Forecasting Methods
Bottom-up forecasting starts at the rep level. Each rep provides deal-level estimates that roll up through teams and regions to a company total. It's grounded in field reality, but tends toward optimism when deal stages aren't rigorously maintained or when reps are incentivized to show healthy pipelines.
Top-down forecasting begins with a market-level target (total addressable market, board expectation, or prior year actuals) and breaks it down by region, product, or team. It's fast for high-level planning but disconnected from pipeline realities. Most organizations use top-down and bottom-up together, triangulating between the two for a more defensible number.
AI-driven forecasting uses machine learning to analyze historical patterns, deal velocity, engagement signals, and external variables, generating continuously updated predictions. Salesforce's 2024 State of Sales report found that sales teams using AI were 1.3x more likely to see revenue growth.
That said, AI accuracy depends entirely on the quality of the CRM data feeding the models. Missing deal stages, inconsistent rep hygiene, and stale contact records all degrade the output — no matter how sophisticated the algorithm.
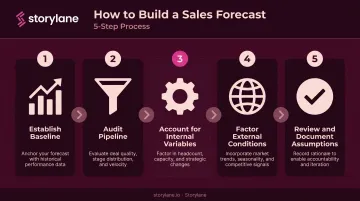
How to Create a Sales Forecast: Step-by-Step
Step 1 — Establish Your Baseline
Pull historical sales data broken down by product, region, rep, and time period to calculate a sales run rate. This gives a neutral starting point that reflects actual performance before any adjustments for optimism, new initiatives, or market changes.
Step 2 — Audit Your Pipeline and Define Stages Clearly
Review all open opportunities in your CRM and ensure every rep is using consistent definitions for stage labels like "commit," "best case," and "pipeline." Assign realistic close probabilities to each stage, and remove or flag deals that haven't progressed in 30 or more days.
This step is where most forecasts fail. A 2024 Clari survey found 71% of revenue leaders reported incorrect or hidden forecast and pipeline details, and 49% couldn't diagnose where pipeline dropoff was actually occurring. Inconsistent stage definitions are the single most common source of forecast error.
Step 3 — Account for Known Variables
Layer in planned changes that will affect the forecast period:
- New headcount and rep ramp timelines
- Pricing changes or promotional discounting
- New product launches or discontinuations
- New territories or market segments
- Known seasonal demand shifts
Each variable should be quantified separately rather than rolled into a single "growth adjustment." This keeps the forecast auditable and makes it easier to isolate which assumptions were right and which were off.
Step 4 — Factor in External Conditions
Incorporate market-level signals that could meaningfully accelerate or slow deal velocity:
- Macroeconomic conditions affecting your buyers' budgets
- Competitor moves or new entrants
- Regulatory changes in key verticals
- Industry growth or contraction trends
These won't always shift your central forecast number, but they should inform your scenario ranges when planning for upside and downside outcomes.
Step 5 — Review, Validate, and Document Assumptions
Walk through the completed forecast with cross-functional stakeholders — finance, sales leadership, and operations. Stress-test key assumptions before you finalize:
- What happens if your top three deals slip a quarter?
- What's the plan if new hires ramp slower than projected?
- Which assumptions are most sensitive to external changes?
Document the logic behind each projection. When a forecast misses, that paper trail tells you exactly which assumption broke — and how to correct it next cycle.
Key Factors That Influence Sales Forecast Accuracy
Internal Factors
These are within your control and should be proactively modeled into every forecast cycle:
- Sales headcount and ramp time — new reps typically take three to six months to reach full productivity; ignoring ramp time leads to over-forecasting
- CRM data quality — only 35% of sales professionals completely trust their organization's data, per Salesforce's 2024 State of Sales report
- Pricing and discounting policy changes — a mid-quarter price increase or a new competitive discount can materially shift close rates
- Product portfolio shifts — launches, sunsets, and feature changes all affect buyer behavior and deal timelines
Getting your internal inputs right is only half the equation. External conditions can shift deal velocity just as quickly — and the best forecasters treat them as scenario variables, not surprises.
External Factors
These can't be controlled, but they can be monitored and incorporated as scenario assumptions:
- Macroeconomic conditions — buyer budget cycles, cost-cutting waves, and credit availability all affect deal velocity
- Competitor activity — a competitor's aggressive pricing campaign or product launch can stall your deals mid-cycle
- Seasonal demand patterns — some industries have predictable buying windows that should always be reflected in the model
- Regulatory and compliance changes — in verticals like healthcare tech, financial services, and cybersecurity, regulatory shifts can accelerate or freeze purchasing decisions
Common Sales Forecasting Challenges (and How to Address Them)
Even well-resourced sales teams run into the same forecasting pitfalls. Here are the three most common — and how to fix them.
Rep Bias and Subjectivity
Optimistic reps inflate deal stages; cautious reps sandbag to manage expectations. Both distort the picture in opposite directions.
To counter this:
- Standardize stage definitions with specific, measurable exit criteria
- Apply probability weighting to each stage rather than relying on rep gut feel
- Introduce an independent review — typically finance — to pressure-test the numbers before the forecast is finalized
Poor CRM Hygiene
Forecasts built on stale or inconsistently updated data will always be unreliable. This is a process problem as much as a technology one.
Fix it by:
- Mandating required fields at each pipeline stage with clear data entry standards
- Running weekly pipeline reviews on all active deals
- Using CRM integrations that auto-update activity data to reduce dependence on manual rep input
Siloed Forecasting Processes
When sales owns the forecast without input from finance or marketing, it misses critical signals — an upcoming campaign that will spike inbound, or a budget constraint that makes the "best case" scenario unrealistic.
Build a cross-functional review cadence with a shared data source. Separate spreadsheets owned by separate teams guarantee misalignment.
Best Practices for Improving Sales Forecast Accuracy
Standardize Your Forecast Cadence and Process
Set a consistent review rhythm: deal-level pipeline updates weekly, full forecast reviews monthly. Use a single source of truth — ideally a CRM-integrated forecasting tool — so all stakeholders work from the same data at the same time. Inconsistent cadences create version confusion and accountability gaps.
Use Leading Indicators to Validate Pipeline Confidence
Close dates and deal stage alone don't tell you whether a deal is genuinely progressing. Behavioral signals from actual buyer engagement give you a more reliable read on deal momentum.
That's where demo engagement data earns its place in your forecast. Storylane's analytics surface time spent on specific features, drop-off points, return visits, and intent scores for every prospect interaction. When those signals sync directly to Salesforce or HubSpot, sales managers can see which opportunities have active, engaged buyers — not just optimistic close dates — giving pipeline-based forecasts a more objective foundation.
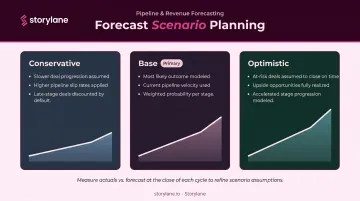
Build Scenario Models and Measure Accuracy Over Time
Create at least three scenarios each cycle:
- Conservative — assumes slower deal progression and higher slip rates
- Base — your most likely outcome based on current pipeline signals
- Optimistic — assumes deals at risk close on time and a few upside opportunities come through
Consistently measure your forecast accuracy against actuals after each period. Over time, this reveals systemic biases — whether your team consistently over-forecasts new business, under-forecasts expansion revenue, or gets caught by late-quarter slippage. Those patterns are fixable once they're visible.
Frequently Asked Questions
What is sales forecasting?
Sales forecasting is the process of estimating future revenue over a specific period — weekly, monthly, quarterly, or annually — using pipeline data, historical performance, and market conditions. It guides decisions across sales, finance, and operations.
What are the steps in a sales forecasting process?
Most forecasting processes follow five steps:
- Establish a historical baseline from past performance data
- Audit and clean your pipeline with consistent stage definitions
- Account for internal variables — headcount changes, pricing updates, product launches
- Factor in external market conditions
- Validate assumptions with cross-functional stakeholders from finance and ops
What are the methods of sales forecasting?
Major methods include quantitative approaches (historical forecasting, moving average, pipeline/lead-driven forecasting, regression analysis) and qualitative or hybrid approaches (bottom-up, top-down, AI-driven). Most organizations combine two or more methods.
What is the best way to forecast sales?
Start with a clean CRM pipeline and standardized deal stage definitions. Add cross-functional input from finance and ops, maintain a consistent review cadence, and layer in AI-driven tools — they improve accuracy most when the underlying data is well-maintained.
What are common sales forecasting challenges?
The most common issues are rep subjectivity and pipeline inflation, incomplete CRM data, and siloed forecasting that lacks cross-functional alignment. Each one has a direct fix: standardized stage criteria, data hygiene workflows, and a shared review cadence across sales, finance, and ops.
How often should sales forecasts be updated?
Deal-level pipeline updates should happen weekly; full forecast reviews work best monthly or quarterly. During rapid growth or market volatility, tighten that cadence — earlier reviews surface pipeline shifts before they become surprises.