Without measurement infrastructure, you're left guessing whether a personalized demo accelerated a deal, created pipeline, or had no effect whatsoever. This article walks through the exact tools, metrics, and methods needed to measure how personalized demos impact conversion at every funnel stage—and how to interpret what the data is actually telling you.
Key Takeaways
- The three key demo impact metrics are engagement completion rate, demo-influenced pipeline, and demo-to-close conversion rate
- Establish a pre-demo baseline of stage-to-stage conversion rates before you can measure any lift
- Three measurement methods: in-demo behavioral analytics, funnel conversion comparison, and A/B testing personalized vs. generic
- Attribution errors — especially last-touch bias and short measurement windows — are the most common reason demo impact gets undercounted
What You Need to Measure Personalized Demo Impact
Reliable measurement depends on having the right tracking setup in place before demos are deployed. Without it, performance data is directional at best.
Tools and Data Sources Required
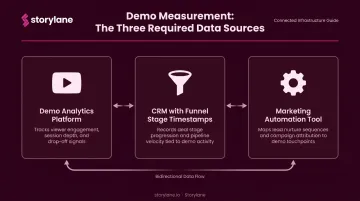
You need three core data sources working together:
- Demo analytics platform — captures step-level engagement, drop-off points, time-on-screen, and completion rates per variant
- CRM with funnel stage timestamps — logs when each prospect entered and exited each funnel stage, with demo touchpoints recorded against contact or opportunity records
- Marketing automation tool — captures lead source, touchpoint history, and persona/segment attributes
Storylane's built-in analytics dashboard captures step-level demo engagement data: completion rates, drop-off by step, and which variants are resonating. It syncs directly to Salesforce, HubSpot, and Marketo via native integrations, so when a visitor engages with a demo and later converts, that lead is automatically attributed back to their demo interaction—no manual data stitching required.
Slack alerts fire in real time when prospects hit engagement thresholds, so sales teams can follow up while intent is highest.
Baseline and Setup Requirements
Before launching personalized demos, capture these baselines:
- Stage-to-stage conversion rates: MQL→SQL, SQL→Opportunity, Opportunity→Closed-Won
- Average sales cycle length by segment or deal size
- Average deal size broken down by ICP attribute (industry, company size)
Segment by persona, industry, or use case before going live. If you don't establish these segments upfront, you won't be able to compare whether a demo built for a CFO performs differently than one targeting a technical evaluator. That comparison is where you'll find the clearest signal on what to optimize next.
Key Metrics to Track for Personalized Demo Impact
Tracking the right metrics reveals not just whether your demos work—but where in the funnel they're creating the most leverage.
Demo Engagement Rate by Variant
The percentage of demo viewers who reach a defined completion threshold (e.g., 70% of steps), broken down by demo variant.
This surfaces which personalized versions hold attention and which lose viewers early. Storylane's internal data across 535,000+ demo sessions provides useful benchmarks:
- Overall average engagement rate: 14.7%
- Ungated demos: 19.4% engagement vs. 9.2% for gated
- Top 10% of demos: 64% completion rate, averaging 9 steps
- Bottom 10% of demos: 1.4% completion rate, averaging 37 steps
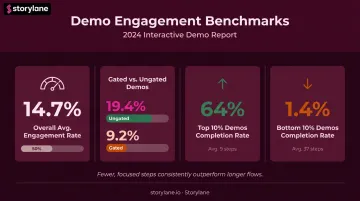
Demo length is the single biggest structural variable. Fewer, focused steps consistently outperform longer flows.
Funnel Stage Conversion Lift
The comparison between pre-demo and post-demo conversion rates at each funnel stage.
Calculate this at MQL→SQL, SQL→Opportunity, and Opportunity→Closed-Won. The goal is to identify which stage shows the largest positive delta after demo deployment—that's your primary optimization target. Benchmarkit's 2026 survey of 173 B2B technology companies found a median win rate of 28%, providing a useful reference point for Opportunity→Closed-Won.
Demo-to-Close Conversion Rate
The percentage of prospects who viewed a personalized demo and converted to a closed deal, compared against those who did not.
This is the most direct ROI signal available. PDQ's product marketing team calculated a 92% conversion lift by comparing site-wide conversion rates before and after their Storylane demo launched—pulling data monthly from Storylane analytics, website conversion data, and Salesforce.
Pipeline Influence Rate
The percentage of total closed or open pipeline that had a personalized demo touchpoint anywhere in the buyer journey.
Storylane's Deal Intelligence feature measures this directly—identifying which deals were influenced by demos and at what stage. Dreamdata, using their own attribution platform alongside Storylane, found that 40.9% of all closed-won new business was influenced by use-case demos, and 17% of renewals were also demo-influenced. ContactMonkey reported $1.3M in influenced pipeline attributed to their interactive demo.
Sales Cycle Length (Demo vs. No Demo Cohorts)
Average days-to-close for deals with a personalized demo touchpoint versus deals without one.
Shorter cycles in the demo cohort indicate the demo is reducing friction during evaluation. Internal research using Factors.ai across 150 deals showed that demo-touched deals closed in 27 days versus 33 days for non-demo deals.
For context, KeyBanc and Sapphire Ventures' 2024 SaaS survey found a median SaaS sales cycle of 6 months—meaning even a six-day reduction at scale compounds meaningfully across a full pipeline.
Methods to Measure Personalized Demo Impact on Your Conversion Funnel
The right method depends on your data maturity. Using more than one in parallel gives the most accurate view of what's actually driving pipeline.
Method 1: In-Demo Behavioral Analytics
What it measures: How individual prospects interact with a demo at the step or module level: where they pause, drop off, or spend the most time.
Tools needed: Demo analytics platform with step-level tracking, account reveal capability, and session-level data.
Steps:
- Enable step-level tracking and define what "meaningful engagement" means for each demo variant. For example, reaching the pricing module or a key feature step counts as a qualified view
- Segment engagement data by persona or firmographic group to identify which variants complete at high rates and which lose viewers early
- Cross-reference high-engagement accounts against CRM records to assess whether deep demo engagement correlates with faster stage progression or higher win rates
Storylane's Account Reveal feature de-anonymizes demo visitors and enriches them with firmographic data, enabling step 3 to happen automatically when integrated with your CRM.
Pros: Most granular signal about what resonates within a demo.
Cons: Measures engagement, not revenue. Pair it with CRM data for full funnel attribution.
Method 2: Stage-by-Stage Funnel Conversion Comparison
What it measures: Conversion rates between a demo-touched cohort and a control group at each funnel stage.
Tools needed: CRM with accurate stage timestamps and demo touchpoint logging; sufficient sample size per cohort.
Steps:
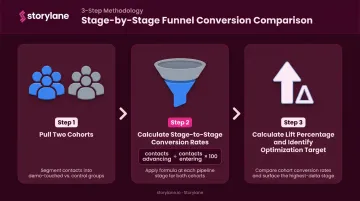
- Pull two cohorts from your CRM: one that received a personalized demo before or during evaluation, and a control group at a comparable stage that did not. Match both cohorts on ICP characteristics (industry, company size, deal size)
- Calculate stage-to-stage conversion rates for each cohort using: contacts advancing to next stage ÷ contacts entering that stage × 100
- Calculate the lift percentage for each stage (demo cohort rate minus control rate) and prioritize the stage with the largest positive delta as your optimization target
Pros: Directly links demos to funnel outcomes and is credible for executive reporting.
Cons: Requires clean CRM data and sufficient deal volume to avoid small-sample distortions.
Method 3: A/B Testing Personalized vs. Generic Demos
What it measures: Whether personalization itself, not just the demo format, improves conversion.
Tools needed: Demo platform with variant tracking, a randomization mechanism (CRM workflow or marketing automation rule), and a predefined success metric.
Steps:
- Define the variable being tested. For example: a demo with the prospect's company name, logo, and industry-specific use case versus the same demo without those personalization tokens. Keep all other outreach variables constant
- Run the test for at least 4–6 weeks, or until each variant has reached a statistically significant sample; Statsig's guidance notes that B2B tests face low traffic volumes and longer cycles, so sample-size calculations should account for your baseline conversion rate and minimum detectable effect
- Compare primary metrics (demo-to-meeting booked, demo-to-opportunity), then check sales cycle length and deal size to confirm personalization is driving quality outcomes, not just volume
Pros: The most rigorous way to prove causation between personalization and conversion lift.
Cons: Requires operational discipline and sufficient deal volume to run cleanly.
How to Interpret Your Demo Impact Data
Misinterpreting demo data is common — teams that act on short measurement windows or noisy signals often make changes that hurt performance rather than help it.
Strong Performance Signal
Healthy demo impact looks like:
- Step completion rates at or above the top 10% benchmark (40%+ per Navattic's benchmark dataset)
- Measurable conversion lift at SQL→Opportunity or Opportunity→Closed-Won
- Shorter average sales cycles in the demo cohort
Next step: Systematically scale the demo variant and personalization approach that produced this result.
Moderate or Ambiguous Signal
Watch for:
- High engagement but stage conversion rates aren't moving
- Conversion rate improved but deal size decreased
This typically means the demo is creating interest without addressing the right buying criteria for actual decision-makers.
What to do: Audit which stakeholders are viewing the demo and whether the content speaks to their evaluation priorities — not just the technical user who clicked through.
Poor or Negative Signal
Warning signs:
- Completion rates well below your defined threshold
- No conversion lift versus the control cohort
- Longer sales cycles in the demo cohort
This usually points to wrong persona targeting, demo content mismatched to the buyer's stage (a feature-heavy demo sent before the prospect understands the problem it solves), or a tracking setup that's missing key touchpoints.
Next step: Run qualitative follow-up—rep debriefs or short post-demo surveys—before making content changes. Data tells you what; these conversations tell you why.
Common Measurement Mistakes to Avoid
Even with the right metrics in place, a few common errors can quietly distort your data and lead to flawed conclusions about what's actually driving pipeline.
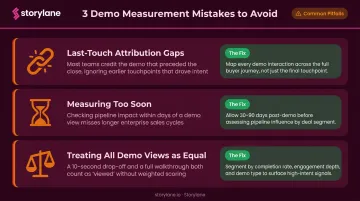
Last-touch attribution gaps: If your CRM only logs the final touchpoint before close, demos that occurred earlier in the funnel appear to have no impact. Forrester notes that no single attribution model can answer every performance question — the fix is switching to multi-touch or pipeline influence reporting.
Measuring too soon: A 2–3 week observation window will show near-zero conversion impact because deals haven't closed yet. Set your minimum window to match your average sales cycle. With a 6-month median SaaS cycle, that means waiting before drawing any conclusions.
Treating all demo views as equal: A prospect who watched 15% of a demo and one who completed 90% represent very different levels of intent. If both count as "demo viewed," your conversion rate will look artificially low for high-intent prospects and inflated for passive ones. Always segment by completion threshold, not just by whether a view occurred.
Best Practices for Ongoing Demo Impact Tracking
Demo measurement shouldn't be a one-time audit. A standing cadence makes it operational:
- Weekly: Monitor step-level drop-off points; flag variants losing viewers at specific modules
- Monthly: Review stage conversion rates by demo variant; update pipeline influence numbers
- Quarterly: Run A/B tests to validate new personalization hypotheses; adjust variants based on accumulated data
Quantitative data tells you what is happening; buyer conversations tell you why. Respond.io reviews demo performance every two weeks—analyzing completion rates, drop-off, and time spent—and iterated their demos until engagement rates doubled from 3% to 6% after adding presenter videos. Both inputs drove that result, not one alone.
Closing that loop quickly is where tooling earns its place. Storylane's Slack alerts notify reps the moment a high-engagement account hits a key step threshold—so follow-up happens while the buyer's interest is still live, not a day later based on a hunch.
Frequently Asked Questions
What metrics should you track to measure the impact of personalized demos on funnel conversion?
Track demo engagement completion rate, stage-to-stage conversion lift (especially SQL→Opportunity and Opportunity→Closed-Won), demo-influenced pipeline percentage, and sales cycle length in demo vs. non-demo cohorts. These four together cover engagement quality, funnel velocity, and revenue attribution.
How do you calculate funnel conversion metrics for personalized demos?
Use the standard formula: contacts advancing to the next stage ÷ contacts entering that stage × 100. Apply this separately to a demo-touched cohort and a control cohort, then subtract control from demo to calculate the lift percentage at each stage.
Which metric is most useful for measuring the effectiveness of personalized demos on your sales funnel?
Demo-to-close conversion rate is the most direct revenue signal. That said, stage conversion lift at SQL→Opportunity is often more actionable: it reflects where personalized demos most influence buyer intent, before the deal is already in motion.
How do you measure whether a personalized demo is better than a generic one?
A/B testing is the most rigorous method. Randomly assign similar prospects to a personalized versus generic version, keep all other outreach variables constant, then compare stage conversion rates, sales cycle length, and deal size across both groups.
How often should you review personalized demo performance data?
Use a tiered cadence: engagement metrics weekly, funnel conversion rates by demo variant monthly, and A/B test results quarterly or once each variant reaches statistical significance.
What data do you need before creating personalized demo measurement benchmarks?
You need historical baseline data: existing stage-to-stage conversion rates, average sales cycle length, and average deal size, all segmented by ICP attributes like industry and company size. Without that pre-demo baseline, there's no reference point for measuring what changed after demos were deployed.