It's a fair question — until you do the math. Manual demos aren't free. They consume one of the most expensive resources a B2B company has: specialist time. And that cost is already being paid every week in SE hours, stalled deals, and missed conversions. It just isn't showing up as a line item.
This guide is a practical playbook for building and presenting an airtight internal business case for demo automation software in 2026 — from calculating your true cost baseline to handling every objection your CFO will throw at you.
Key Takeaways
- SEs spend 11–25 hours per week on repetitive standard demos, according to Navattic's State of Demo Automation 2026
- Deals with a demo touch in the first 14 days close at a 72% win rate vs. 59% without — a gap worth citing in any budget deck
- The strongest budget case starts with cost baseline math, not feature lists
- Finance teams discount optimistic projections; anchor every claim to conservative, published benchmarks
- Proposing a pilot with defined success criteria is more persuasive than asking for full annual approval upfront
The Hidden Cost of Manual Demo Processes
Before you talk about benefits, talk about what the current approach actually costs. Manual demos are not a free activity — and any budget conversation that skips this step will lose before it starts.
Calculating the True Cost of SE and AE Demo Time
The math is straightforward. Start here:
Cost of manual demos = (demos per week) × (prep + delivery hours per demo) × (fully-loaded hourly SE cost)
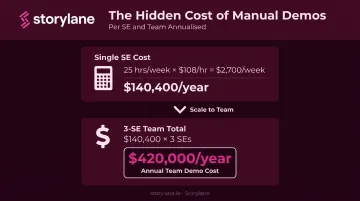
According to Navattic's State of Demo Automation 2026, the average SE runs 7 demos per week, each taking 3.6 hours including prep — that's 25 hours per week on standard, repetitive demos. And 94% of SEs say they conduct repetitive demos at least sometimes.
Now attach a cost. Using Glassdoor's 2026 US Sales Engineer median total pay of $158,000 and a benefits burden of approximately 43% (per BLS March 2026 compensation data), the fully-loaded hourly cost of a US SE runs roughly $108/hour.
Run the numbers:
- 25 hours/week × $108/hour = $2,700/week per SE
- Annualized: $140,400 per SE spent on repetitive demos
For a team of three SEs, that's over $420,000 per year in specialist time — before you've accounted for a single dollar in missed pipeline.
The Opportunity Cost Hidden in Your Pipeline
The second hidden cost is deal velocity. When demos are slow to schedule or too generic, deals stall. Navattic's data shows that deals where a demo is sent within the first 14 days of deal creation achieve a 72% win rate versus 59% without a demo touch, a 13-point difference that repeats across every deal in your pipeline.
Translate that to your numbers: if your team runs 50 deals per quarter and the win rate delta is 13 points, you're potentially leaving 6–7 deals per quarter on the table purely from timing.
The Ramp Time Cost Nobody Tracks
Slow deal velocity is visible in your CRM. Ramp time costs are not — but they're just as real.
Manual demo creation is a learned skill that takes weeks to develop. Demo automation gives new AEs proven, reusable demo flows from day one, cutting ramp time by weeks for teams scaling headcount.
Key ROI Metrics to Anchor Your Budget Case
A business case lives or dies by the metrics it uses. Finance and sales leadership don't respond to "better demos" — they respond to numbers tied to revenue.
Sales Cycle Compression
Walnut's platform data shows teams using interactive demos move through sales cycles 34% faster on average. That's a vendor-reported figure, so treat it conservatively. Even at half that rate — a 17% compression on a 90-day cycle — you're removing roughly 15 days per deal.
Here's how to make it concrete for your proposal:
- Average sales cycle: 90 days
- 50 open deals in pipeline
- Conservative 20% compression = 18 days removed per deal
- Result: revenue recognized 2–3 weeks earlier per deal, every quarter
For deals in the $25K–$100K ACV range, that timing shift can move entire cohorts across quarterly revenue recognition thresholds.
Win Rate and Conversion Lift
Two benchmarks worth anchoring your case to:
- Deals with 2–3 demo touches close at 72% vs. 59% without a demo touch (Navattic 2026)
- Interactive demos drive 32% higher conversion rates than traditional static approaches (Walnut)
Frame these for your proposal this way: "If our current close rate is 22% and demo automation lifts it by even 5 points on our current pipeline volume of $4M, that's $200K in incremental closed revenue." Use your actual numbers — the structure is what matters.
SE Capacity Multiplier
This is the argument that resonates most strongly with finance: capacity without adding headcount.
The SourceDay example from Navattic's customer data shows solutions consultants spent 30% less time on early-stage demos after implementing demo automation. Those hours shift to high-value evaluations, POCs, and enterprise deals.
For a team of three SEs spending 25 hours each per week on repetitive demos, a 30% reduction frees up 22.5 hours per week — roughly the equivalent of half a headcount — to focus on complex deals that actually require human expertise.
Pipeline Influence and Deal Intelligence
Capacity gains are easier to sell internally when you can also show how demos connect to closed revenue. That's where attribution comes in.
Storylane's Demo Signals tracks which accounts engage with demos, scores them by intent, and pushes that data directly into Salesforce and HubSpot, making attribution visible inside your existing CRM.
This creates the feedback loop your finance team will ask for: a live measurement system that validates the investment quarter over quarter, not just at budget approval.
How to Build the Business Case Step by Step
Use this as a checklist when drafting your internal proposal.
Step 1: Establish a Cost Baseline
Document current-state costs before anything else:
- Tally SE/AE hours per week on repetitive demos (use the 7 demos × 3.6 hours calculation as a starting point)
- Multiply by fully-loaded hourly cost
- Add estimated opportunity cost from slow deal velocity (use the win rate delta × average deal value)
This "status quo cost" is the number every investment must beat. Skip this step, and you're making a feature argument. Build it, and you're making a financial one — which is the only argument finance teams respond to.
Step 2: Define Target Metrics and Expected Lift
Pick two or three KPIs your business actually tracks:
- Sales cycle length (days)
- Close rate (%)
- SE hours on repetitive demos per week
Attach conservative improvement estimates — not best-case scenarios. Finance teams discount optimistic projections. Anchoring to the lower end of documented benchmarks is more persuasive than claiming the headline number.
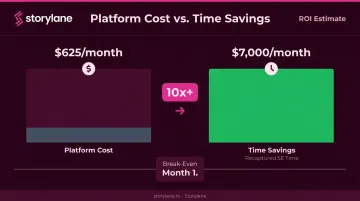
Step 3: Calculate the Payback Period
The formula: (annual platform cost) ÷ (monthly value of improvements) = months to break even
A worked example using Storylane's Growth plan at $625/month (5 seats):
- Conservative estimate: demo automation saves 15 SE hours/week per SE
- At a loaded cost of $108/hour: $1,620/week in recaptured time per SE
- Monthly time savings (one SE alone): ~$7,000
- Monthly platform cost: $625
The time savings alone exceed the platform fee by more than 10x. That's the payback argument — and it doesn't even include pipeline and conversion improvements.
Note: Verify current Storylane pricing at storylane.io/plans before finalizing your calculations, as plans and pricing are subject to change.
Step 4: Propose a Pilot, Not a Full Commitment
Rather than asking for annual contract approval upfront, propose a 60 or 90-day pilot with success criteria defined in advance. This structure lowers perceived risk for approvers and creates a natural checkpoint where your own data makes the case.
Define the pilot metrics clearly:
- SE hours recaptured per week
- Demo-influenced pipeline value
- Conversion lift on pilot cohort vs. control
Storylane's Free plan and Request Trial option make it straightforward to run this kind of pilot without requiring full budget sign-off upfront.
Step 5: Document the Cost of Inaction
Include a "cost of delay" calculation in your proposal. Waiting another quarter means:
- Another 13 weeks of full SE hours on repetitive demos
- Another quarter of deals closing at the lower win rate
- Continued ramp friction for any new hires
Delaying the decision carries a real dollar figure — one that grows with every week of inaction. Put that number in the proposal.
How to Pitch to Different Stakeholders
The same business case lands differently depending on who's in the room. Build one primary deck, then adjust the emphasis based on the approver.
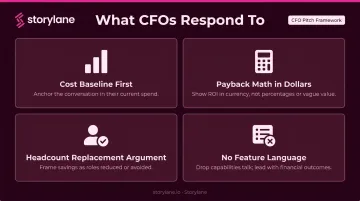
Pitching to the CFO or VP Finance
CFOs are focused on cost control. Deloitte's Q1 2026 CFO Signals survey found 52% of North American CFOs cite cost management as their primary internal concern — and 53% named automation and technology upgrades as the most effective levers for controlling costs.
Build your pitch around four things CFOs respond to:
- Lead with the cost baseline before anything else
- Show the payback math with specific dollar figures
- Emphasize that the platform replaces headcount cost (no new SEs needed to scale)
- Drop all feature language — none of it belongs in this room
Pitching to the VP of Sales or CRO
Sales leaders respond to pipeline math. Show what a 5–10% improvement in close rate does to quarterly revenue on your current pipeline volume. Highlight that demo automation gives every rep a reliable, consistent edge — and that new AEs can run polished demos from week one instead of week six.
Fewer days per deal means more deals fit into a quarter — that's the sales cycle compression argument in one sentence.
Pitching to the Head of Marketing
Frame the marketing pitch around self-serve engagement and lead quality. Interactive demos embedded on a website convert site visitors into qualified pipeline without requiring a sales call. Storylane's RepX feature takes this further: it engages visitors conversationally, qualifies intent, and routes leads to the CRM automatically — 24/7, no sales rep required.
Connect the pitch to metrics marketing already owns: MQL quality, cost per lead, and demo-engaged visitor conversion rates.
Handling Common Budget Objections
Every internal pitch for new software runs into the same three objections. Having data-backed responses ready is the difference between a decision and a "let us think about it."
"We can just run live demos — it's part of the job."
This objection treats live demos as a free resource. They aren't. With 94% of SEs running repetitive demos and the average SE spending 25 hours per week on standard demos, live demos are the expensive part. They're not a cost-free alternative — they're the cost you're trying to justify.
The real question isn't whether you need demos. It's how much you're paying to deliver them manually — and whether that's the highest-value use of SE time.
"The platform cost is too high."
Flip the question: what is the current cost of manual demos?
Once the baseline is established — $140K+ per SE per year in repetitive demo time alone — the platform fee is typically a fraction of what the team already spends. Most teams recoup the investment within the first quarter based on SE time savings alone.
"We don't have bandwidth to build and maintain demos."
Modern platforms are built for non-technical users. Storylane's AI suite lets teams build demos in minutes rather than days, with a sample demo created in under two minutes. The AI suite includes:
- One-click contextual annotations
- AI voiceovers and video avatars
- An HTML editor for custom edits
Ongoing maintenance is faster than rebuilding manual demos repeatedly. A demo library built once can be updated, duplicated, and personalized across hundreds of accounts without starting from scratch.
Frequently Asked Questions
How much does it cost to produce a demo?
Manual demos carry hidden costs: SE time, environment prep, rehearsals, and coordination overhead that typically run thousands of dollars per demo when fully loaded. Platform-based automated demos cost a fraction of that as a monthly fee and scale across unlimited sessions, making them substantially cheaper per delivery at any meaningful volume.
What is the ROI of demo automation software?
Published benchmarks show win rate improvements of 13+ percentage points, SE capacity gains of 30% or more on early-stage demo time, and measurable sales cycle compression. As the demo library grows, engagement analytics also sharpen targeting and follow-up timing — compounding those gains quarter over quarter.
How do I calculate the cost of our current manual demo process?
Use this formula: (hours per week on repetitive demos) × (fully-loaded hourly SE/AE cost) × 52 weeks = annual manual demo cost. That figure can be compared directly to platform pricing to establish the payback period.
What metrics should I track to prove demo automation ROI after purchase?
Track these four: SE hours recaptured per week, demo-influenced pipeline value (via CRM integration), change in average sales cycle length, and close rate delta on deals with versus without demo touches.
How long does it take to see measurable results from demo automation?
Time savings appear in the first week of adoption. Conversion and pipeline metrics typically surface within 30–60 days, and sales cycle compression shows up in 60–90 day reporting cycles. That timeline is why a 90-day pilot with defined success criteria is the right framing for the initial budget ask.
What objections should I prepare for when pitching demo automation budget internally?
The three most common are cost, bandwidth, and "we already run live demos." All three are countered most effectively by establishing the cost baseline first — once finance sees what manual demos actually cost in SE hours and pipeline velocity, the platform investment becomes the obvious alternative.