Introduction
Revenue forecasts look healthy. The pipeline is full. Then the quarter ends and you've missed the number — again.
The problem usually isn't a lack of deals. It's that no single metric connects deal volume, deal value, win rate, and speed into one number you can actually act on. Sales leaders end up managing four separate variables in isolation, and without a unified view, it's nearly impossible to know which lever to pull before the quarter slips away.
Pipeline velocity fills that gap. It measures exactly how much revenue your pipeline generates per day — making it a real-time health indicator rather than a lagging report of what already went wrong.
According to a 2024 Gong survey of 2,015 business leaders, 81% of companies missed revenue forecasts in at least one quarter between 2021 and 2023. Pipeline velocity doesn't guarantee you'll hit your number — but it tells you early enough to course-correct before the quarter closes.
What follows is the definition, exact formula, B2B SaaS benchmarks, and specific tactics to move all four velocity levers.
Key Takeaways
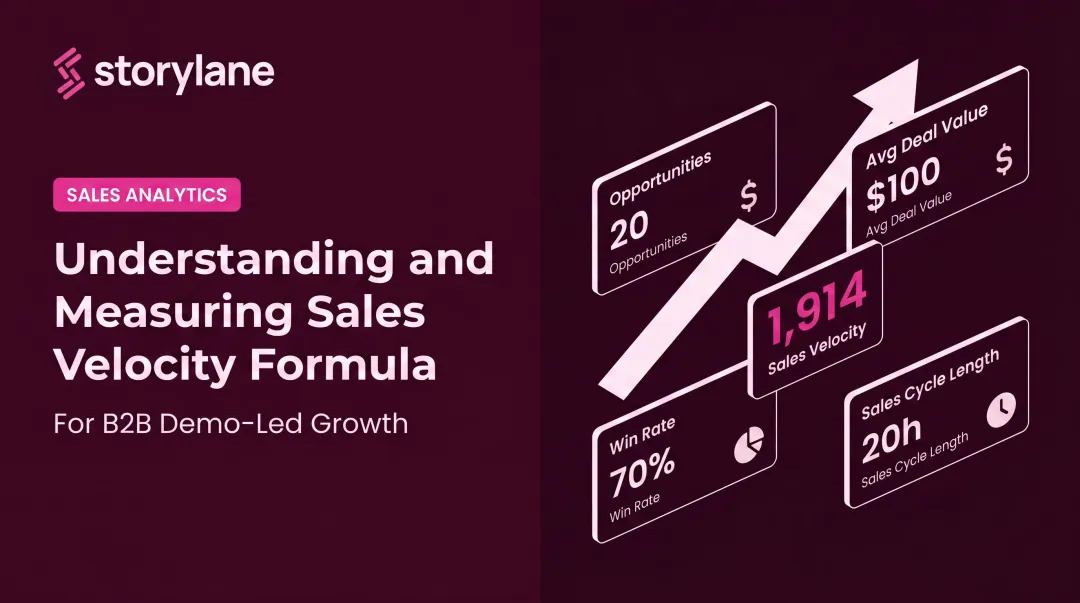
- Pipeline velocity = revenue generated per day, calculated from four variables: opportunities, deal size, win rate, and sales cycle length
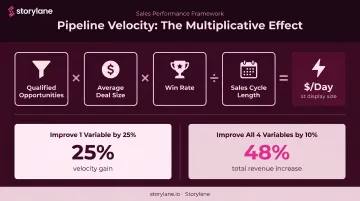
- Formula: (Opportunities × Avg. Deal Size × Win Rate) ÷ Sales Cycle Length (days)
- Improving any single lever increases velocity; improving all four multiplies the effect
- Track velocity as a trend over time — weekly or monthly — to spot meaningful movement
- Counting unqualified leads as opportunities is the most common mistake that distorts the metric
What Is Pipeline Velocity?
Pipeline velocity measures how quickly qualified leads move through your sales pipeline and convert into revenue — expressed as a dollar amount per day.
Think of your pipeline as a physical pipe. Narrow sections, blockages, and leaks all reduce flow rate. A clean, wide pipe moves maximum volume at maximum speed. High pipeline velocity means few friction points between first contact and closed deal.
It's a Derived Metric, Not a Direct Control
You can't improve pipeline velocity directly. You can only improve the four underlying variables that produce it: number of opportunities, average deal size, win rate, and sales cycle length. Velocity is the output: the number that tells you whether those inputs are working together or fighting each other.
Why Trends Matter More Than Snapshots
A single velocity reading tells you almost nothing. $2,000/day in Q1 means very little without context. The same number in Q3 — after it was $1,200/day in Q1 and $1,600/day in Q2 — tells you the sales engine is accelerating. Consistent downward movement is an early warning sign months before it shows up in closed revenue.
Pipeline Velocity vs. Sales Velocity: Is There a Difference?
In practice, there's no meaningful difference.
HubSpot defines sales velocity as "the measurement of how quickly deals move through your pipeline and generate revenue." Salesforce uses nearly identical language. Both use the same four-variable formula.
Some teams draw a subtle distinction between the two:
- Pipeline velocity emphasizes stage-by-stage movement through the funnel
- Sales velocity emphasizes the daily dollar value of revenue generated
Treat them as synonyms and pick whichever term your team will use consistently.
The Pipeline Velocity Formula: Breaking Down All Four Variables
The standard formula, verified by both HubSpot and Salesforce:
$$\text{Pipeline Velocity} = \frac{\text{Qualified Opportunities} \times \text{Average Deal Size} \times \text{Win Rate}}{\text{Average Sales Cycle Length (days)}}$$
The result is a dollar-per-day figure representing daily revenue flow through your pipeline.
Variable 1 — Number of Qualified Opportunities
This is leads that have passed your qualification criteria — BANT, MEDDIC, or whatever framework your team uses. Not total leads in the CRM, not MQLs, not "anyone who filled out a form."
Padding this number with unqualified deals inflates velocity on paper while your actual pipeline rots. The fix is ruthless qualification at entry, not charitable counting after the fact.
Variable 2 — Average Deal Size
The average contract value (ACV) of closed-won deals over a defined lookback period — typically 90 days. One caveat: if you sell to both SMB and enterprise, don't blend these into a single average. Calculate pipeline velocity separately by segment.
A $500 SMB deal and a $50,000 enterprise deal have completely different economics. Blending them produces a number that accurately describes neither.
Variable 3 — Win Rate
Closed-won deals divided by total closed deals (won + lost) over the same lookback period. Win rate is heavily influenced by lead quality — the earlier you qualify, the higher this number climbs. According to Winning by Design, average SaaS performance runs around 1 in 5 (20%), with best-in-class teams reaching 1 in 4 (25%).
Variable 4 — Sales Cycle Length
The average number of days from opportunity creation to close, pulled directly from your CRM. This is different from time-in-stage metrics — it's the total elapsed time across the full journey. Use the same lookback period as your other variables.
Worked Example
$$\frac{60 \text{ opportunities} \times $5{,}000 \text{ ACV} \times 20% \text{ win rate}}{30 \text{ days}} = $2{,}000/\text{day}$$
At $2,000/day, you're looking at roughly $60,000/month or $180,000/quarter in projected revenue.
Bump win rate from 20% to 25% and the math shifts:
$$\frac{60 \times $5{,}000 \times 25%}{30} = $2{,}500/\text{day}$$
Two things this illustrates:
- A 25% improvement in one variable produces a 25% increase in velocity
- Improve all four variables by 10% simultaneously, and Altify's research shows the combined effect reaches a 48% total revenue increase — the formula is multiplicative, not additive
Why Pipeline Velocity Matters for Your Sales Team
Pipeline Health Diagnosis
Pipeline velocity makes the "bloated but inactive" pipeline visible before it damages a quarter. A pipeline full of stale opportunities looks healthy on a coverage ratio report but registers immediately in velocity, because deals that aren't progressing extend average cycle length and suppress win rate.
Tracking velocity against prior periods answers the question that coverage ratios can't: are deals actually moving, or just accumulating?
Accurate Forecasting
Because velocity is grounded in actual CRM data — real win rates and real cycle lengths — it produces more reliable projections than gut-feel estimates.
The math is direct:
- $2,000/day × 90 days = $180,000 for the quarter
That's your forecast, derived from inputs you can verify and improve, not a number someone backed into from a target.
Channel and Attribution ROI
That same forecasting logic extends to your channel mix. Segmenting pipeline velocity by lead source reveals which channels generate higher-value deals — not just deal volume.
Consider two channels side by side:
| Channel | Opportunities | ACV | Win Rate | Revenue Impact |
|---|---|---|---|---|
| Channel A | 20 | $8,000 | 30% | $48,000 |
| Channel B | 50 | $3,000 | 12% | $18,000 |
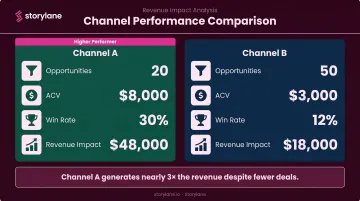
Channel B looks more active. Channel A generates nearly three times the revenue. Velocity math surfaces this gap; a coverage ratio never would.
Pipeline Velocity Benchmarks: What "Good" Looks Like in B2B SaaS
There is no universal benchmark for pipeline velocity. The right number depends on your ACV, market segment, team size, and business model. The only meaningful comparison is your own trend.
That said, sales cycle benchmarks by ACV tier provide useful context for the denominator in your calculation.
Sales Cycle Length by ACV Tier (B2B SaaS)
Based on the KBCM 2021 Private SaaS Company Survey of 354 private SaaS companies:
| ACV Tier | 25th Percentile | Median | 75th Percentile |
|---|---|---|---|
| Below $5K | 1.0 month | 2.0 months | 2.6 months |
| $5K–$15K | 2.0 months | 3.0 months | 3.8 months |
| $15K–$25K | 2.8 months | 3.0 months | 4.0 months |
| $25K–$50K | 2.6 months | 3.3 months | 6.0 months |
| $50K–$100K | 4.0 months | 6.0 months | 7.5 months |
| Over $100K | 6.0 months | 7.0 months | 12.0 months |
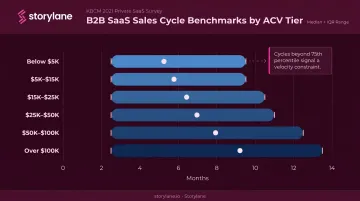
If your cycles are running longer than your ACV tier's 75th percentile, cycle length is likely your primary velocity constraint.
Win Rate: The Other Variable Worth Benchmarking
Cycle length only tells part of the story. Win rate is the other lever that directly moves pipeline velocity, and it's worth calibrating against external data as well.
Winning by Design puts average SaaS win rates at roughly 1 in 5, with best-in-class teams closing 1 in 4. Teams that qualify earlier in the funnel consistently land at the higher end of this range — fewer deals entered means fewer deals lost on deals they were never going to win.
How to Improve Pipeline Velocity: Strategies for Each Lever
Lever 1 — Increase Qualified Opportunities
Focus on quality over quantity. Investing in ICP definition and account-based targeting means that deals entering the pipeline are genuinely winnable — which raises both opportunity count and downstream win rate simultaneously.
Removing unqualified deals from the pipeline actually improves velocity. Fewer bad deals means higher win rates and shorter average cycle lengths, which more than compensates for the reduced opportunity count.
Lever 2 — Improve Win Rate Through Better Buyer Experience
Win rate improves when buyers arrive at discovery calls already informed and convinced of value, not encountering your product for the first time during a live demo.
One high-impact tactic is enabling prospects to self-explore the product before speaking to a rep. Interactive product demos let buyers experience the product on their own terms, at their own pace. When they get on a call, they're past the "what is this?" phase and asking "how do we implement this?" — which compresses the evaluation phase and improves close rates.
According to Navattic's 2025 State of the Interactive Product Demo report (analyzing 28,000+ demos), interactive demos increased win rates by approximately 20–30% and reduced sales cycle length. Gartner separately reports that 75% of B2B buyers prefer a rep-free sales experience at some stage. Meeting buyers where they want to be is no longer optional.
Platforms like Storylane let sales and marketing teams build these interactive demos without engineering involvement, embedding them in outbound sequences, landing pages, and pre-meeting emails. Teams like ContactMonkey have seen demo completion rates of 50–60% with 28% of demo leads converting to opportunities — roughly double their rate from other inbound sources.
Lever 3 — Increase Average Deal Size
Improving win rate creates the foundation; increasing deal size is where that momentum compounds. Deal size grows through deeper discovery and better packaging, not just price increases. Reps who understand the full scope of a prospect's pain across departments, use cases, and time horizons consistently close larger deals than those who stop at the surface-level need.
Segmenting pipeline velocity by deal tier also helps. Once you know your enterprise segment generates 3× the velocity per deal as your SMB segment, rep prioritization decisions become straightforward.
Lever 4 — Shorten the Sales Cycle
Larger deals can mean longer cycles — so the fourth lever is eliminating the friction that inflates them. The most common sources of cycle drag:
- Repetitive discovery handoffs where context is lost
- Slow follow-up (HBR research found firms responding within one hour were nearly 7× more likely to qualify a lead than those waiting even one additional hour)
- Missing documentation that stalls procurement
- Misaligned stakeholders who need to be re-educated at each stage
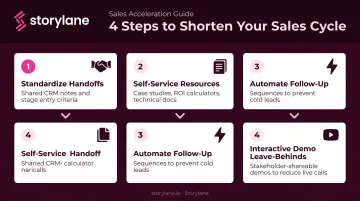
Practical fixes:
- Standardize handoffs with shared CRM notes and defined entry criteria for each stage
- Arm prospects with self-service resources — case studies, ROI calculators, technical docs — so they can answer internal questions without waiting for a rep
- Automate follow-up sequences so no lead goes cold between touchpoints
- Use interactive demos as leave-behinds that stakeholders can share internally, reducing the number of live calls needed to reach consensus
Track Velocity by Pipeline Stage, Not Just Overall
A single aggregate velocity number hides where deals actually stall.
If deals spend twice as long in the Proposal stage as anywhere else, you've identified a specific problem: pricing clarity, procurement friction, or a missing business case template. Stage-level velocity tracking converts a general performance gap into a concrete, solvable bottleneck rather than a vague directive to "close faster."
Common Misconceptions About Pipeline Velocity
Misconception 1 — Treating All Leads as Qualified Opportunities
Counting every MQL or early-stage lead inflates the opportunity variable and makes velocity look healthy on paper. The calculation requires leads that have passed a defined qualification threshold — not leads who expressed mild interest.
Misconception 2: Velocity Is a Point-in-Time Number
A one-time velocity calculation is meaningless in isolation. Velocity is a trend metric — a high Q3 reading that follows two low quarters tells a very different story than consistent quarter-over-quarter growth.
Track it at minimum quarterly, and always watch the direction, not just the number.
Misconception 3: Total Pipeline Velocity Tells the Full Story
Teams that track only aggregate pipeline velocity miss where deals actually stall. A healthy top-of-funnel combined with a broken mid-funnel can mask serious problems — consider what stage-level breakdowns reveal:
- Discovery to demo: High conversion here often hides a slow, leaky proposal stage
- Proposal to legal: Deals can stall for weeks with no visible impact on total velocity
- Legal to close: A bottleneck here inflates average cycle length across the entire pipeline
A deal that breezes through discovery and dies in legal review looks identical to a healthy deal until you're tracking stage-level data.
Frequently Asked Questions
What is pipeline velocity?
Pipeline velocity is a sales metric measuring how quickly qualified opportunities move through your pipeline and generate revenue, expressed as a dollar-per-day figure. It's calculated from four variables: number of qualified opportunities, average deal size, win rate, and average sales cycle length.
How do you calculate pipeline velocity?
The formula is: (Number of Qualified Opportunities × Average Deal Size × Win Rate) ÷ Average Sales Cycle Length in days. Each input should be pulled from CRM data over a consistent lookback period (90 days is the standard starting point, with longer periods recommended for enterprise sales cycles).
What is the rule of thumb for pipeline velocity?
There's no single universal benchmark. The practical rule of thumb is to track velocity as a trend over consecutive periods (weekly or quarterly) and focus on consistent upward movement rather than chasing an absolute number. Your own historical baseline is the only benchmark that truly matters.
How can I improve pipeline velocity?
The four levers are: increasing qualified opportunities, improving win rate, raising average deal size, and shortening the sales cycle. Reducing friction in the buyer experience, such as enabling self-serve product exploration before sales calls, is one of the fastest ways to improve win rate and compress cycle length at the same time.
What is the difference between pipeline velocity and sales velocity?
Pipeline velocity and sales velocity use the same formula and measure the same concept. Some teams distinguish them by saying pipeline velocity focuses on stage-by-stage movement while sales velocity emphasizes daily dollar value ; for practical tracking purposes, they're interchangeable.
What are the four variables in the pipeline velocity formula?
The four variables are:
- Number of qualified opportunities in the pipeline
- Average deal size or ACV
- Win rate (% of closed deals won)
- Average sales cycle length in days
Improving any one of these increases velocity. Improving all four compounds the effect.