Introduction
Every sales leader knows the feeling: quarter-end arrives, the pipeline looked healthy three months ago, and the team still missed quota. The pipeline wasn't the problem — the reading of it was.
Pipeline coverage — the ratio of total pipeline value to revenue target — is one of the most cited metrics in B2B sales and one of the most misread. According to Ebsta's 2025 GTM Benchmarks report, 78% of sellers missed quota in 2025, up from 69% the year before. Yet pipeline generation increased 23% in the same period. More pipeline didn't translate to more revenue — because volume alone doesn't tell you what will close.
This article covers:
- The pipeline coverage formula and how to calculate it accurately
- How to read benchmarks honestly against your own conversion rates
- The difference between weighted and unweighted coverage methods
- What high and low ratios actually signal — and the mistakes teams make treating coverage as a forecast rather than a diagnostic
Key Takeaways
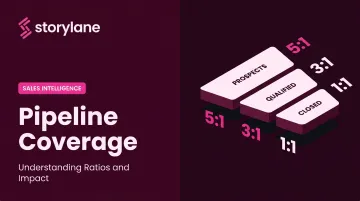
- Pipeline Coverage = Total Pipeline Value ÷ Revenue Target — a 3x ratio means three times your quota sits in open opportunities
- Benchmark ranges vary by segment: Enterprise (3x–5x), Mid-Market (2.5x–4x), SMB (2x–3x) — your win rate determines where in that range you actually need to be
- Weighted coverage (deal value × close probability) gives a far more accurate picture than unweighted
- Both under-coverage (below 2x) and over-coverage (above 5x–8x) are warning signs with distinct consequences
- Coverage is a directional metric, not a forecast; pair it with win rate, deal velocity, and stage conversion data for reliable revenue prediction
What Is Pipeline Coverage in B2B Sales?
Pipeline coverage answers one foundational question: do we have enough open opportunities to hit our revenue target?
The formula:
Pipeline Coverage = Total Pipeline Value ÷ Revenue Target
A team with $900,000 in active deals and a $300,000 quarterly target has 3x coverage. Simple arithmetic — but the interpretation requires more context.
Where to Track It
Coverage should be monitored at three levels, each serving a different purpose:
- Rep level — identifies individuals at quota attainment risk before it becomes a quarter-end problem
- Team/segment level — surfaces gaps by region, vertical, or product line that aggregate numbers hide
- Company-wide — aligns marketing and sales on how much pipeline generation is actually required
What Coverage Doesn't Tell You
This is the part that trips teams up. Pipeline coverage is a planning and diagnostic metric — it confirms whether sufficient volume exists, not which deals will close, when they'll close, or whether the pipeline contains genuinely qualified opportunities.
In B2B sales, this distinction matters more than in most contexts. Long sales cycles, complex buying committees, and chronic deal slippage mean a 1:1 ratio between pipeline and target is never enough. According to Ebsta's 2024 B2B Sales Benchmarks report, 44% of deals slipped in 2023, and when deals slip, win rates drop by 67% — particularly when delays exceed eight weeks. Teams need a coverage buffer sized to their real close rate — if you close 25% of pipeline, you need 4x coverage, not the generic "3x" figure that gets passed around.
Pipeline Coverage Benchmarks: What Ratio Should You Target?
There is no universal correct ratio. The right target depends on your team's win rate, average deal size, sales cycle length, and historical data. Generic benchmarks give you a starting point — your own data gives you the answer.
Benchmark Ranges by Segment
| Segment | Recommended Coverage |
|---|---|
| Enterprise | 3x – 5x |
| Mid-Market | 2.5x – 4x |
| SMB / High-velocity | 2x – 3x |
Enterprise requires higher coverage for clear reasons: longer sales cycles, more stakeholders, greater slippage risk, and higher deal values that amplify any single loss. SMB sales move faster with fewer decision points, so less buffer is needed.
The Math Behind the Target
Win rate drives the minimum coverage requirement more than any other variable. The relationship is straightforward:
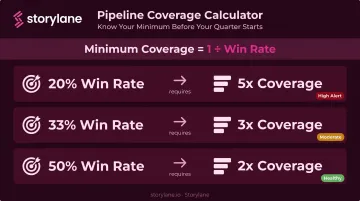
- 25% win rate → need at least 4x coverage to hit target
- 33% win rate → 3x coverage is sufficient
- 50% win rate → 2x coverage breaks even
The formula: Minimum Coverage = 1 ÷ Win Rate
Run this against your trailing 12-month win rate rather than relying on segment benchmarks. A team closing 20% of qualified opportunities needs 5x coverage just to break even — the Enterprise benchmark of 3x–5x would leave them exposed.
Other Variables That Shift the Target
Win rate isn't the only lever:
- Sales cycle length — longer cycles create more opportunity for deals to slip or go dark, demanding additional cushion
- Deal age distribution — a pipeline full of opportunities created 90+ days ago needs scrutiny before you trust the ratio
- Territory maturity — new territories with underdeveloped relationships require higher coverage than established markets with repeat buyers
How to Calculate Pipeline Coverage: Unweighted vs. Weighted
Unweighted Coverage
The basic calculation:
- Define the time period (monthly or quarterly)
- Sum the total value of all open opportunities expected to close in that period
- Divide by the revenue target
Unweighted coverage treats every deal as 100% likely to close. That's the problem. A $500,000 opportunity in early discovery gets counted the same as one a week from signing.
Weighted Coverage
The more precise alternative multiplies each opportunity's value by its stage-based close probability, then sums those weighted values across all open deals. This is often called "expected revenue" — and it produces a more accurate picture than raw totals ever will.
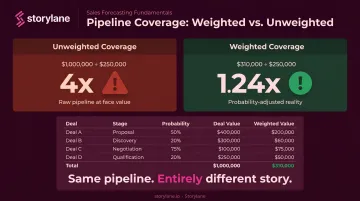
Concrete example:
| Deal | Value | Stage Probability | Weighted Value |
|---|---|---|---|
| Deal A | $200,000 | 80% | $160,000 |
| Deal B | $150,000 | 40% | $60,000 |
| Deal C | $250,000 | 20% | $50,000 |
| Deal D | $400,000 | 10% | $40,000 |
| Total | $1,000,000 | — | $310,000 |
Against a $250,000 target: unweighted coverage = 4x (looks healthy), weighted coverage = 1.24x (dangerously thin). Same pipeline, entirely different story.
Modern CRM platforms automate both calculations. HubSpot and Salesforce both use stage-based probability mappings to generate weighted deal values natively — no spreadsheet required.
Adding Behavioral Signals to Probability Weighting
Stage-based probability is a structural signal. What it misses is buyer behavior — whether anyone on the other side of a deal is actually engaging.
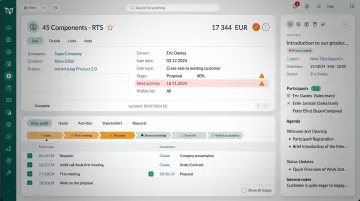
Storylane's Deal Intelligence feature addresses this gap by pulling in demo engagement data as behavioral signals layered onto open pipeline. Specifically, it tracks:
- Time spent per session and overall completion rate
- Return visits and multi-session patterns
- Stakeholder views across the buying group
- CTA clicks indicating purchase intent
A deal where three stakeholders have completed 85% of a demo across multiple sessions carries a genuinely different close probability than one where no one has engaged at all. Real-time Slack alerts notify reps when cold deals show renewed activity, making it possible to re-prioritize opportunities before the quarter slips away.
What Your Pipeline Coverage Ratio Is Really Telling You
Coverage is a diagnostic signal. The number tells you where you stand — understanding why it sits there tells you what to do about it.
When Coverage Is Below 2x
Low coverage typically points to one of three problems:
- Inadequate pipeline generation volume
- Weak lead qualification letting low-fit opportunities enter the funnel
- Quota targets that aren't calibrated to market reality
At this level, missing quota stops being a performance issue and becomes structural. The math simply doesn't support hitting target, regardless of individual effort. The fix has to be structural too: prospecting ramp-up, ICP refinement, or quota recalibration.
When Coverage Exceeds 5x–8x
High coverage is not automatically healthy. It frequently signals pipeline bloat:
- Reps padding funnels with unqualified prospects to hit coverage targets
- Stale deals sitting dormant for 60+ days that should have been removed
- Inflated opportunity values that don't reflect realistic deal sizes
According to Clari's 2024 revenue leak survey, 71% of revenue leaders cited incorrect or hidden forecast and pipeline details as a core challenge — a figure that reflects exactly what excessive, unmanaged coverage produces. The metric looks strong while the underlying quality is deteriorating.
The Sweet Spot
Healthy coverage means enough buffer to absorb natural slippage and delays, with every opportunity reflecting genuine buyer interest, clear next steps, and realistic close timelines. When both are present, coverage becomes a reliable leading indicator — not just a number that looks good in a forecast review.
Common Pipeline Coverage Mistakes and How to Avoid Them
Mistake 1: Treating Coverage as a Forecast
A 4x ratio doesn't mean the team will hit quota. It means they might hit quota if their historical win rate holds across the current pipeline. Conflating these two things leads to planning errors, inadequate corrective action, and missed targets that feel like surprises even though they were visible weeks earlier.
Mistake 2: Ignoring Stage Distribution
A pipeline of 20 early-stage deals produces the same raw coverage ratio as 20 late-stage deals — but those situations have nothing in common. Teams should segment their coverage analysis by pipeline stage. Opportunities that skip stages are a red flag: Ebsta's 2024 data shows deals that skip a stage are 46% less likely to close, and win rates are 203% higher when deals close within historical stage benchmarks.
Mistake 3: Applying One Target Across All Reps
New reps have lower win rates. Underdeveloped territories carry more uncertainty. Complex enterprise deals require more coverage than transactional SMB motion. Holding all reps to the same coverage multiple distorts accountability. Consider what each situation actually requires:
- New enterprise reps typically need 5x to offset lower win rates
- Established SMB reps may be fine at 2.5x with a proven motion
- Underdeveloped territories warrant higher multiples until win rate data matures
Mistake 4: Measuring Coverage Only at Quarter Start
Coverage shifts constantly — deals push, new opportunities enter, and others go dark. A pipeline that showed 4x on January 1st may be sitting at 2.2x by February 15th if three key deals have slipped.
Weekly pipeline reviews aren't bureaucracy. They keep the metric current so managers can intervene while there's still time to add pipe, accelerate deals, or reset quota expectations before the quarter closes.
Frequently Asked Questions
What is pipeline coverage?
Pipeline coverage is the ratio of total open pipeline value to the revenue target for a defined period. It tells sales teams whether they have enough active opportunities to realistically hit quota. It's expressed as a multiple — 3x means three times your target sits in open deals.
How do I calculate pipeline coverage?
Divide total pipeline value by your revenue target. $900,000 ÷ $300,000 = 3x coverage. For greater accuracy, use weighted pipeline: multiply each deal's value by its close probability, sum those figures, then divide by target. This removes the false confidence of treating every deal as equally likely to close.
What is a good pipeline coverage ratio?
Benchmarks by segment: Enterprise (3x–5x), Mid-Market (2.5x–4x), SMB (2x–3x). The right ratio for your team depends on your win rate — use Minimum Coverage = 1 ÷ Win Rate as a personalized starting point before adjusting for your specific market conditions.
What is the difference between pipeline coverage and forecast coverage?
Pipeline coverage measures total opportunity volume against target: do you have enough deals to work? Forecast coverage applies win probabilities to generate a predicted revenue outcome, answering how much you'll likely close. One captures volume; the other estimates what that volume will actually yield.
What does low pipeline coverage mean for a sales team?
Coverage below 2x–3x typically points to insufficient pipeline generation, poor lead qualification, or quotas that outpace what the market can support. At that level, missing quota becomes structurally probable — rep performance alone can't compensate when there simply aren't enough qualified opportunities to close.
How does win rate affect pipeline coverage requirements?
Win rate and required coverage are inversely related. A 20% win rate requires 5x coverage to break even; a 40% win rate only needs 2.5x. Improving win rate is the most efficient way to reduce the pipeline volume burden — it lets the same team hit the same target with less total pipeline to manage.