Introduction
Deal volume is up. Headcount isn't. And every quarter, presales and SE leaders face the same uncomfortable meeting: justify the team's tools, show the impact, defend the budget.
Demo automation works — 70% of presales teams now use it, according to Vivun's 2025 State of Sales Engineering report. What most SE leaders can't do is connect the tool to a number a CFO will respect. "We save time on prep" doesn't survive a QBR.
This guide gives you a practical framework to fix that. You'll find:
- The four measurable levers that drive demo automation ROI
- A step-by-step model for building your business case from scratch
- How to get executive buy-in by speaking the language of pipeline and revenue
- The KPIs to track after launch so the numbers keep compounding
Every number here is defensible — built on inputs your own CRM and calendar data can support, not vendor benchmarks or extrapolated guesswork.
Key Takeaways
- Demo automation ROI rests on four levers: SE time reclaimed, deal coverage per SE, win rate improvement, and post-sale continuity.
- Saved hours only create ROI when reinvested into higher-impact work — POCs, enterprise deals, enablement.
- Executives respond to pipeline capacity and win rate arguments, not efficiency percentages.
- Tie demo engagement signals directly to CRM deal outcomes to build the strongest business case.
- Start with one high-friction workflow, measure its baseline, then use real data to fund the broader program.
Why Presales Teams Struggle to Prove Demo Automation ROI
Presales sits in an awkward position organizationally. SEs influence deals constantly — running technical discovery, building proof points, unblocking security reviews — but that influence rarely shows up cleanly in a CRM as a closed-won driver. The attribution is diffuse by design.
Demo automation compounds the problem. Teams adopt tools for efficiency, then measure the wrong things: demos delivered, prep hours saved, links shared. None of those metrics connect directly to win rate, deal size, or cycle length — the numbers CFOs and CROs actually care about.
Research from the PreSales KPI guide captures this precisely: presales teams default to easy activity metrics rather than revenue impact metrics like technical win rate or deal coverage distribution. The result is a reporting gap that makes presales look like a cost center at QBR time rather than a revenue multiplier.
The Executive Disconnect
There are effectively two different conversations happening:
- SE leaders report: demos delivered, prep hours saved, tool adoption rates
- CFOs and CROs ask: does this help us close more revenue, and does it free capacity we can redeploy without hiring?
Translating efficiency into pipeline language is the core challenge — and it's exactly what this guide walks through.
The Four Core ROI Levers of Demo Automation
Lever 1: SE Prep Time Reclaimed
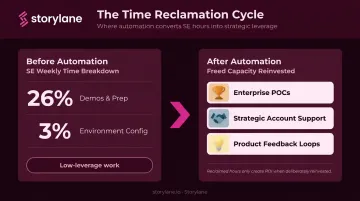
SEs spend a significant portion of their week on demo work. Vivun's 2025 benchmark data shows 26% of SE weekly time goes to product demonstrations including prep and follow-up, with another 3% on managing and configuring demo environments. That's nearly a third of each SE's capacity tied up in demo logistics before a single discovery call happens.
The ROI formula here is straightforward:
Hours saved per deal × number of deals per quarter × SE fully-loaded hourly cost = dollar value of reclaimed capacity
For cost inputs, the U.S. Bureau of Labor Statistics reports a $121,520 median annual wage for sales engineers as of May 2024 — though SaaS SE total compensation (including equity and bonus) runs considerably higher. Use your company's actual fully-loaded cost for a defensible number.
One critical caveat: reclaimed time only creates ROI if it's deliberately reinvested. If SEs use freed hours to check Slack, the lever doesn't move revenue. Build the reallocation into the model from day one, targeting high-value activities: enterprise POCs, strategic account support, and product feedback loops.
Lever 2: Deal Coverage Without Headcount Growth
Executives aren't asking for more headcount — they're asking whether the existing team can carry more.
According to Vivun's 2025 data, the most common AE:SE ratios are 3:1 (23% of organizations), 2:1 (21%), and 4:1 (21%). The strategic benchmark most high-performing teams target is 4:1. The implication: teams already stretched thin need coverage solutions that don't require new headcount approvals.
When self-serve and automated demos let prospects get answers independently (before or between live SE touchpoints), each SE can effectively support more parallel opportunities.
The ROI framing:
- Identify how many additional deals per quarter each SE could cover with automation handling repetitive walkthroughs
- Multiply by average deal value
- That's incremental pipeline capacity added without a single new hire
Lever 3: Win Rate and Pipeline Velocity
Demo automation stops being an efficiency story the moment it starts moving revenue metrics.
Interactive demos create measurable engagement signals — step completion, replay depth, feature exploration — that correlate with purchase intent. When a champion spends 40 minutes working through a technical flow and returns twice, that's a buying signal worth acting on immediately.
Key data points from the field:
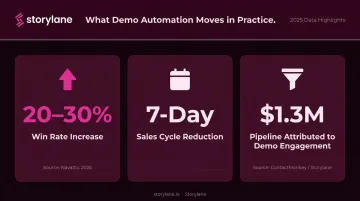
- Navattic's 2025 State of the Interactive Product Demo report found survey respondents reported interactive demos increased win rates by approximately 20–30% and shortened sales cycles by an average of 7 days — treat these as directional benchmarks, not guarantees
- ContactMonkey reported a 3x sales velocity improvement and a 28% demo-to-opportunity rate (2x higher than other inbound sources) after implementing Storylane interactive demos, along with $1.3M in pipeline directly attributed to demo engagement
Lever 4: Post-Sale Continuity and Reduced Rework
Most business cases stop at presales efficiency — they miss the post-sale value entirely. Demo assets don't retire at the close.
When the same interactive demos used during presales are reused for onboarding, customer success handoffs, and expansion plays:
- "What did we buy?" escalations drop because the value case is already documented and visual
- CS teams enter with shared reference material instead of starting from scratch
- Time-to-value improves because customers can self-navigate product flows at their own pace
Forrester has noted that the renewal decision is often made in the first 90 days of the post-sale journey — which means onboarding quality is a direct churn risk factor. Demo assets that bridge the presale and onboarding experience reduce that risk.
In a CFO conversation, quantify this as churn risk mitigation: if a single at-risk renewal represents $150K ARR, demo-assisted onboarding that prevents even one churn event per quarter outweighs most tooling costs on its own.
How to Build a Demo Automation ROI Model From Scratch
The three-step process: establish a current-state baseline using your own data, project the post-automation scenario using conservative assumptions, then connect demo engagement to live CRM data. Build the model on your numbers, not a vendor's. Executives will ask where the inputs came from — you need a defensible answer.
Step 1: Capture Baseline Inputs
Gather these four data points before modeling anything:
| Input | What to Measure | Where to Find It |
|---|---|---|
| SE prep hours per deal | Average hours spent per stage 2+ opportunity | Calendar data, SE time logs |
| Active deals per SE per quarter | Current deal load per SE | CRM pipeline reports |
| Win rate with vs. without demo | Closed-won rate segmented by demo delivery | CRM opportunity reports |
| Days from discovery to proof-of-value | Average cycle length to first POV delivered | CRM stage timestamps |
If some of these don't exist yet, a 30-day baseline experiment across two or three deals will generate usable numbers quickly.
Step 2: Model the Post-Automation Scenario
Apply conservative improvement percentages to each input, then convert each improvement to a dollar figure:
- 40% reduction in prep hours × deals per quarter × SE hourly cost = capacity reclaimed
- 20% more deals covered per SE × average deal value = incremental pipeline capacity
- 5–8 percentage point win rate lift × total pipeline volume = incremental revenue impact
Underestimate and overdeliver. A model built on 40% prep reduction that actually delivers 55% builds credibility. A model promising 70% that delivers 40% kills future budget requests.
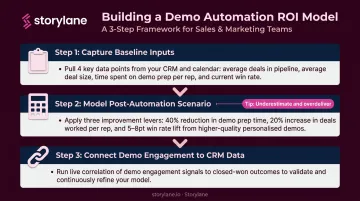
Step 3: Connect Demo Engagement to CRM Pipeline Data
The most credible ROI models don't rely on projections alone — they show live correlation between demo engagement and deal outcomes.
Storylane's CRM integrations with Salesforce and HubSpot push demo engagement data directly into corresponding opportunity records. For each prospect, that includes:
- Which steps they completed and how long they spent on each
- How many times they returned to the demo
- Intent classification (low, medium, or high) based on engagement depth
These fields sync to CRM for pipeline prioritization, which creates the infrastructure for a real business case. Instead of saying "we estimate win rates improve 6 points," you can show that deals with high demo engagement closed at X% versus Y% for those without.
Dreamdata, a B2B revenue attribution platform, found that Storylane demos influenced 40.9% of all closed-won new business — made measurable only because engagement data was flowing into their CRM in a structured, trackable way.
Getting Executive Buy-In: Turning Metrics Into a Business Case
The audience for this business case is a CFO, CRO, or VP of Sales. They don't care about demos delivered. They ask two questions: "Does this help us close more revenue?" and "Does this free capacity we can redeploy without hiring?"
Frame everything around those two questions.
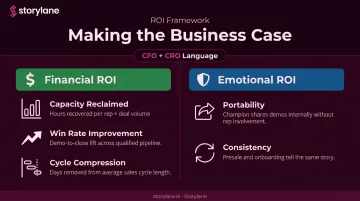
Addressing Financial and Emotional ROI
Financial ROI breaks down into three measurable drivers:
| ROI Driver | Calculation | Example |
|---|---|---|
| Capacity reclaimed | SE hours freed × deal value unlocked | 20 hrs/quarter per SE × $80K ACV |
| Win rate improvement | Percentage lift × pipeline volume | +6 pts × $5M pipeline = $300K |
| Cycle compression | Faster deals = better cash flow + forecast accuracy | 7-day avg reduction × deal volume |
Emotional ROI is what actually converts skeptical stakeholders, and most presenters skip it entirely.
Champions evaluating a new solution carry personal risk: their reputation, their team's workload, their forecast predictability. Demo automation reduces that risk in two specific ways:
- Portability: Buyers can share interactive demos internally, multi-threading the deal without requiring another SE call. Storylane's Buyer Hubs consolidate demos in a single shareable link — making it easy for a champion to walk their CFO through the value case on their own schedule.
- Consistency: When the presale demo and the onboarding experience tell the same story, post-sale surprises drop. That predictability matters to every stakeholder in the buying group.
According to Forrester's 2026 State of Business Buying report, B2B buying groups are growing larger, procurement is more influential, and trials are essential for reducing buyer risk. Interactive demos directly address that shift.
Handling the Most Common Budget Objections
Three objections come up almost every time:
"Who owns demo governance at scale?" Assign a lead demo editor, tie demos to a quarterly review cadence, and build sunset rules into the workflow. Storylane's template-based approach lets teams duplicate and customize from a controlled library, keeping unofficial versions from spreading.
"How do we avoid creating a content graveyard?" Demo ownership plus defined review triggers keeps the library live. Analytics data — completion rates, engagement drop-off — flags underperforming demos for retirement before they become dead weight.
"What about security and compliance?" Modern platforms include SSO, export controls, and anonymized data handling. For Storylane specifically, confirm current compliance documentation (SOC 2, GDPR, DPA availability) directly with their team before presenting to legal or procurement.
How to Track Demo Automation ROI After Launch
Don't wait for a full quarter of data before measuring. Run a 30-day baseline experiment: select two or three deals, log prep time and time-to-proof before automation, then compare the same metrics after the interactive demo goes live. That before/after comparison carries more weight in any business review than forward-looking projections alone.
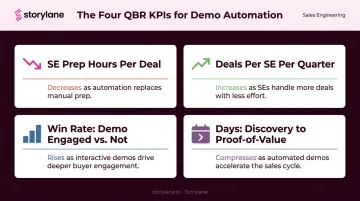
The Four QBR KPIs
Report on these four metrics every quarter:
- SE prep hours per stage 2+ deal — should trend down over time
- Deals per SE per quarter — should trend up as coverage capacity improves
- Win rate delta: deals with demo engagement vs. without — the clearest revenue signal
- Average days from discovery to proof-of-value — measures sales velocity directly
Storylane's engagement analytics and CRM integrations track the last two automatically — surfacing which prospects completed demos, where they dropped off, and how that engagement maps to deal outcomes — without manual reporting overhead.
The Reinvestment Principle
ROI from demo automation compounds only if reclaimed SE hours are deliberately redirected to higher-leverage work. If the freed time disappears into lower-priority tasks, the lever stops moving.
Build the reallocation into the business case from the start. Define specifically where reclaimed capacity goes:
- Enterprise POC design for complex, high-value accounts
- Strategic account acceleration for deals in late-stage stalls
- Product feedback loops that connect SE field insights to roadmap decisions
That specificity makes the ROI model more credible and gives SE leaders a concrete narrative for headcount justification conversations later.
Frequently Asked Questions
How do you calculate the ROI of demo automation for presales?
Sum three value streams: SE time reclaimed (hours saved × SE cost), incremental pipeline capacity (additional deals per SE × average deal value), and win rate improvement (percentage lift × pipeline volume). Compare the total to annual platform cost. Use conservative assumptions and your own CRM data as inputs, not vendor benchmarks alone.
What metrics should SE leaders track to prove demo automation value?
Track four core KPIs: SE prep hours per deal (trending down), deals covered per SE per quarter (trending up), win rate for deals with demo engagement versus without, and average days from discovery to proof-of-value delivery. These map directly to what executives monitor.
How long does it take to see ROI from demo automation?
Most teams see measurable prep time savings within the first 30 days after launching a single automated workflow. Win rate and velocity improvements typically become visible within one full quarter of consistent data, which is enough to show a trend without extrapolating.
How do you get executive buy-in for a demo automation investment?
Connect the investment to outcomes executives already monitor: pipeline capacity, win rate, and forecast accuracy. Lead with the financial model, then reinforce with softer proof points — champions sharing demos internally, post-sale consistency reducing renewal surprises.
What is a good SE-to-AE ratio benchmark for presales teams?
According to Vivun's 2025 data, the most common ratios are 3:1 (23% of organizations) and 2:1 (21%), with 4:1 as the strategic benchmark for high-performing teams. Demo automation typically improves coverage without changing headcount, shifting each SE's capacity to support a higher ratio.
How does demo automation reduce SE burnout and workload?
Automation removes repetitive, low-leverage tasks from SE calendars: generic product walkthroughs, environment configuration, basic feature explanations. That frees SEs for complex, high-judgment work — enterprise POCs, security deep dives, strategic deal support — which improves both capacity and job satisfaction.