Introduction
Most B2B revenue teams don't have a lead shortage problem. They have a prioritization problem.
Pipelines fill up fast, but not every lead converts at the same rate. Sales reps waste hours chasing contacts who were never going to buy, while high-intent prospects go cold waiting for follow-up. According to Salesforce, reps spend 60% of their time on non-selling tasks — and that number climbs when there's no system for separating real opportunities from noise.
Lead scoring fixes this. It assigns numerical values to leads based on how well they match your ideal customer profile and how actively they're engaging with your brand. The result is a composite score that tells reps exactly who to call first.
This guide covers what lead scoring is, how the models work, how to build one from scratch, and how to keep it accurate over time.
Key Takeaways
- Lead scoring ranks leads by purchase likelihood using fit (who they are) and engagement (what they do)
- High-intent signals like demo requests and pricing page visits should carry far more weight than passive actions like blog visits
- Negative scoring and score decay are essential for keeping the model accurate over time
- Start with manual scoring, then move to predictive models as your data volume grows
- Demo engagement is one of the strongest intent signals available — and feeds directly into your CRM scoring
What Is Lead Scoring?
Lead scoring assigns numerical values — typically on a 1–100 scale — to leads based on two dimensions: fit (who they are) and engagement (what they do). The resulting composite score predicts how likely a lead is to buy.
Explicit vs. Implicit Data
Accurate scoring requires both data types working together:
- Explicit data — information a lead provides directly: job title, company size, industry, location, budget
- Implicit data — behavior inferred from observed actions: pages visited, content downloaded, demo viewed, pricing page accessed
Neither is enough on its own. A perfect-fit VP of Sales who never engages is worth less than one already requesting demos.
What a Lead Score Actually Does
Scores aren't just a ranking — they drive action:
- High scores → routed to sales for immediate follow-up
- Mid-range scores → entered into nurture sequences until intent signals strengthen
- Low scores → deprioritized or disqualified so reps stop burning time on bad-fit prospects
How Scoring Aligns Sales and Marketing
That routing logic only works if both teams agree on what the scores mean. Without shared criteria, marketing optimizes for volume while sales complains about quality.
Lead scoring replaces gut-feel judgments with a shared, data-backed definition of "qualified" — one both teams align on before any lead changes hands.
Why Lead Scoring Matters for B2B Revenue Teams
Without a scoring system, all leads look equal. Reps treat a cold blog subscriber the same as a VP who just visited your pricing page — and high-intent buyers go cold while teams work down the wrong list.
The Core Problem It Solves
According to a 2016 Demand Gen Report survey, 74% of respondents cited lead prioritization as the biggest benefit of scoring. Prioritization is precisely what most B2B teams lack.
The downstream benefits extend further:
- Gives revenue forecasts a more reliable foundation through scored, ranked leads
- Moves reps to engage prospects at peak intent, not arbitrary follow-up intervals
- Shifts campaign evaluation from volume to lead quality
- Creates shared criteria so marketing and sales agree upfront on what "ready" means
Warning Signs Your Team Needs Lead Scoring
- Sales regularly complains that MQLs aren't ready to buy
- No documented, agreed definition of what "qualified" means
- Leads go cold because follow-up timing is inconsistent
- Marketing can't connect campaign spend to pipeline
If two or more of those are true, scoring isn't optional — it's overdue.
Lead Scoring Models: Types and How They Work
Three main model types exist. The right choice depends on your sales motion, data availability, and how complex your buying process is.
Demographic and Firmographic Scoring (Fit)
Fit-based scoring evaluates whether a lead matches your ideal customer profile using explicit data:
- Job title and seniority (decision-maker vs. contributor)
- Company size and revenue band
- Industry vertical
- Geographic location
- Technographic data (what tools they already use)
Adobe Marketo's published scoring model assigns +10 points for Aerospace, +5 for Manufacturing, +10 for companies with 1,000–9,999 employees, and -10 for companies with fewer than 10 employees — a concrete illustration of how point values reflect ICP alignment.
Data quality matters here. Validity's 2025 CRM Data Management report found 76% of respondents report less than half of their CRM data is accurate and complete, and 37% say poor data quality directly causes revenue loss. Outdated firmographics will cause the model to prioritize the wrong accounts.
Behavioral Scoring (Engagement)
Engagement-based scoring evaluates buying intent through implicit signals. Not all behaviors carry equal weight:
| Intent Level | Behavioral Signal | Example Point Value |
|---|---|---|
| Low | Blog visit, social follow | +2–5 points |
| Medium | Email open, content download, webinar attendance | +5–15 points |
| High | Pricing page visit, demo request, form submission | +25–50 points |
Adobe Marketo's model assigns +50 points for a demo request, +15 for a tradeshow visit, and +5 for a white paper download : a spread that reflects actual intent differences, not arbitrary weighting.
Interactive product demo engagement belongs in the high-intent tier. A prospect who works through a guided product demo has actively invested time evaluating your solution — that's a different signal than someone who read a blog post.
Platforms like Storylane make this signal measurable: demo analytics surface completion rates, time spent per step, features explored, and return visits. The Account Reveal feature can de-anonymize demo visitors and attach firmographic data, giving your scoring model both behavioral and fit signals from a single interaction. These events sync directly to Salesforce and HubSpot, so demo engagement flows into your model automatically.
Hybrid Scoring (Fit + Engagement)
Combining both dimensions produces a prioritization matrix that tells you exactly what to do with each lead:
| Fit | Engagement | Action |
|---|---|---|
| High | High | Sales-ready — follow up immediately |
| High | Low | Right profile — nurture until intent signals appear |
| Low | High | Disqualify or route to a different motion |
| Low | Low | Ignore entirely |
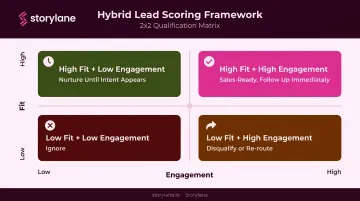
This matrix is where scoring becomes useful. Without the fit dimension, you chase anyone who clicks. Without the engagement dimension, you call people who match your ICP but aren't ready to buy.
How to Build a Lead Scoring System in 5 Steps
Step 1: Define Your Ideal Customer Profile
The scoring model is only as accurate as the ICP behind it. Start by analyzing closed-won deals to identify patterns:
- Which job titles appeared most often?
- What company sizes had the best win rates?
- Which industries closed fastest?
Pair that data with qualitative input from sales — they know what makes a great customer versus a frustrating one. The ICP becomes your scoring blueprint: every criterion you assign points to should map back to a signal that appeared in your best-fit wins.
Step 2: Identify and Assign Point Values to Scoring Criteria
Point values should reflect actual conversion correlation, not assumptions. Pull your CRM data and ask:
- Which job titles close at the highest rate?
- Which behavioral signals most reliably predict pipeline progression?
- What's the gap in close rate between a pricing page visitor and a blog subscriber?
A simple illustrative example based on published benchmarks:
| Action | Points |
|---|---|
| Demo request submitted | +50 |
| Pricing page viewed | +25 |
| Webinar attended | +15 |
| Content downloaded | +5 |
| Blog post viewed | +2 |
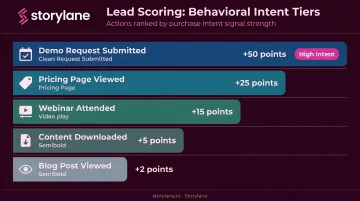
The gap between a demo request and a blog view should be large — because the conversion likelihood difference is large.
Step 3: Set MQL and SQL Score Thresholds
Determine what score range constitutes "sales-ready" by looking at where closed customers clustered historically. Salesforce Trailhead recommends starting with a 100-point threshold. Adobe Marketo's example model uses 50 points, based on an average of four touchpoints.
Neither is universal. Treat your initial threshold as a hypothesis, test it against real conversion data, and adjust. Leads that fall below the threshold should enter nurture programs — not get ignored.
Step 4: Implement Negative Scoring and Score Decay
Two mechanisms keep the model honest:
Negative scoring removes points when leads show disqualifying behavior:
- Unsubscribes or bounced emails (-5 to -10)
- Competitor company domain matches (-20)
- Non-buyer roles: students, job seekers (-10)
- Wrong industry or outside service area (-15)
Score decay handles the other side: it reduces scores automatically when engagement goes cold. Stale activity from 18 months ago shouldn't inflate a lead's current priority. Adobe Marketo's model applies -10 points for 90 days of inactivity — a reasonable starting benchmark.
Step 5: Operationalize in Your CRM
Managing negative scoring rules and decay timers manually becomes unsustainable fast. Implement scoring logic inside your CRM or marketing automation platform so scores:
- Update automatically as leads engage
- Trigger routing to the right rep when thresholds are hit
- Launch nurture workflows for leads that fall below the threshold
Storylane integrates directly with Salesforce, HubSpot, and Marketo, so interactive demo engagement data flows automatically into your scoring workflows. No manual exports, no data lag — just intent signals that update scores in real time.
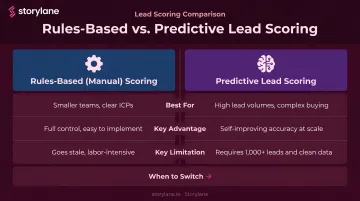
Manual vs. Predictive Lead Scoring
Rules-Based (Manual) Scoring
Teams assign point values based on judgment and historical patterns. Point values are fixed until someone updates them.
Best for: Smaller teams, clear ICPs, simpler buying processes
Limitations: Labor-intensive to maintain, prone to going stale, relies on assumptions that may not hold over time
Predictive Lead Scoring
Machine learning analyzes patterns in historical conversion data to determine which attributes and behaviors actually correlate with closed deals — then scores new leads accordingly.
Best for: High lead volumes, clean historical data, complex buying processes
Minimum data requirements vary by platform. Microsoft Dynamics 365 requires at least 40 qualified and 40 disqualified leads. Salesforce Einstein requires at least 1,000 leads created in the last 200 days with at least 120 converted.
Start with rules-based scoring to build a foundation and validate which criteria actually matter. Move to predictive scoring as lead volume and data quality grow. Either way, plan for regular reviews — both models drift as your ICP and buyer behavior evolve.
Lead Scoring Best Practices
Align sales and marketing before launch. Start by documenting shared MQL and SQL definitions, then build a feedback loop where sales reports back on which scored leads actually converted. HubSpot's 2025 data shows only 30% of professionals believe sales and marketing are closely aligned — meaning most teams set point values without the input that would make them accurate.
Use account-level scoring for enterprise B2B. Gartner's 2025 survey of 632 B2B buyers found buying groups range from 5 to 16 people across up to 4 functions — scoring only the original contact misses the deal entirely. Instead:
- Track engagement across all contacts at the same account
- Weight scores based on seniority and decision-making authority
- Flag cross-functional engagement (e.g., both IT and a business leader active) as a strong deal signal
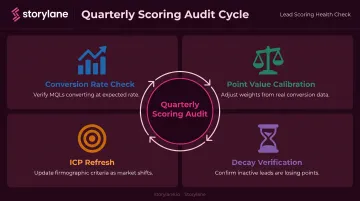
Audit the model quarterly. Stale models send sales chasing the wrong leads. Each quarter, run through:
- Conversion rate check — are MQLs converting at the expected rate?
- Point value calibration — adjust weights based on actual conversion data
- ICP refresh — update firmographic criteria as your market shifts
- Decay verification — confirm inactive leads are losing points as expected
Stale CRM data is one of the most common scoring mistakes. Accurate scoring depends on high-quality, continuously updated records.
Frequently Asked Questions
How do you calculate lead scoring?
Assign point values to each qualifying attribute and behavior, sum the points to produce a total score, then compare against preset thresholds to determine follow-up action. For example: a demo request (+50) plus pricing page visit (+25) plus matching job title (+15) produces a score of 90, triggering immediate sales outreach.
What is an example of lead scoring?
A VP of Sales at a 500-person SaaS company (high fit) who visited the pricing page and requested a demo (high engagement) scores 80+, triggering immediate sales outreach. A marketing intern at a 10-person startup who downloaded one blog post scores around 15 and enters a nurture sequence.
What is the difference between lead grading and lead scoring?
Lead scoring uses numerical points to measure engagement and predict conversion likelihood. Lead grading uses letter grades (A–D) to evaluate how closely a lead matches the ideal customer profile. Many teams use both: a grade for fit, a score for intent.
How is lead scoring used in insurance?
Insurance companies use lead scoring to prioritize policy inquiries by assigning points based on fit (age, location, coverage type sought) and engagement (quote requests, calculator tool usage, return visits). This helps agents focus on applicants most likely to purchase rather than working every inquiry equally.
What is a good lead score threshold for sales handoff?
The right threshold depends entirely on your conversion data. Published examples range from 50 points (Adobe Marketo's four-touchpoint model) to 100 or even 150 points (Salesforce Trailhead examples). Start with a round number, measure what score range your actual closed customers hit, and adjust accordingly.
What is predictive lead scoring?
Predictive lead scoring uses machine learning to identify which attributes and behaviors in your historical data correlate with closed deals, then applies those patterns to rank new leads automatically. It eliminates manual point assignment and improves accuracy at scale, but requires sufficient deal volume and clean historical data before the model becomes reliable.