Introduction
Most B2B sales teams face the same frustrating reality: they generate plenty of leads but watch most of them disappear before closing. According to Adobe Marketo, 50% of leads in a typical system aren't ready to buy — and without the right processes to qualify, nurture, and engage them, that pipeline simply never closes.
Most teams have a conversion problem, not a lead generation problem.
This article covers what you need to close that gap: what lead conversion actually means, the metrics worth tracking, and six strategies sales and marketing teams can implement to improve conversion rate across the funnel.
Key Takeaways
- Lead conversion rate = (Converted Leads ÷ Total Leads) × 100 — define your conversion event before calculating
- Speed-to-lead matters: conversion rates are 8x higher when reps respond within five minutes
- Lead scoring separates high-intent prospects from low-intent noise — behavioral signals matter as much as demographics
- Interactive demos let prospects arrive at sales calls already familiar with your product — shortening cycles and raising close rates
- Sales and marketing alignment — shared definitions, SLAs, and dashboards — ensures qualified leads reach the right rep at the right time
What Is Lead Conversion?
Lead conversion is the end-to-end process of moving a prospect from initial interest to paying customer. It's not a single event — it's a series of transitions across the funnel.
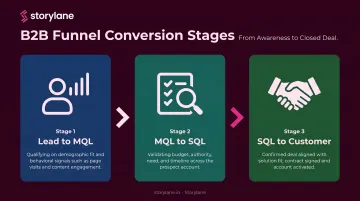
The three key stages most B2B teams track:
- Lead → MQL (Marketing Qualified Lead): A prospect meets demographic and behavioral criteria suggesting genuine fit and interest
- MQL → SQL (Sales Qualified Lead): Sales confirms the lead is worth pursuing based on budget, authority, need, and timeline
- SQL → Customer: The deal closes
The Lead Conversion Rate Formula
Lead Conversion Rate = (Number of Converted Leads ÷ Total Number of Leads) × 100
"Converted" means different things depending on what you're measuring. A marketing team might count MQL progression as a conversion; a sales team might only count closed deals. Before calculating, define your conversion event. Without that alignment, the number tells you nothing about where the funnel is actually breaking down.
Key Metrics to Track Lead Conversion Performance
Conversion rate alone doesn't tell you where the funnel is leaking. These supporting metrics show where the problem is.
Lead-to-Sale Conversion Rate
Distinct from overall conversion rate, this measures how many qualified leads ultimately become customers. It's the most direct measure of bottom-funnel health and revenue efficiency. Once you have this number, the supporting metrics below help explain why it looks the way it does.
Supporting Metrics
| Metric | What It Measures | Why It Matters |
|---|---|---|
| Time-to-conversion | Avg. days from first touch to closed deal | Identifies sales cycle drag |
| Cost per conversion | Total spend ÷ new customers acquired | Determines profitability of your conversion investment |
| Lead source conversion rate | Which channels produce leads most likely to close | Guides budget allocation |
What's a "Good" Conversion Rate?
Benchmarks vary significantly by industry. According to Ruler Analytics, software companies average 7.6%, professional services 6.1%, and marketing/advertising 6.2%. B2B SaaS website-to-lead conversion sits lower — around 1.1% — because the denominator includes all site traffic, not just qualified prospects.
External benchmarks give you a rough sanity check, but your own historical data drives better decisions. Establish your baseline, then set improvement targets against that — not against a competitor's average in a different market segment.
6 Proven Strategies to Improve Lead Conversion Rate
Sharpen Lead Qualification to Prioritize High-Intent Prospects
Filling your pipeline with unqualified leads doesn't just inflate vanity metrics — it wastes the time of your most expensive resource: your sales reps.
MarketingSherpa found that 73% of B2B leads aren't sales-ready, yet many teams hand them off anyway. The same research documented a case where implementing lead scoring increased conversions by 79%.
Build a scoring framework that combines two signal types:
- Demographic fit: job title, company size, industry, tech stack
- Behavioral signals: pages visited, content downloaded, pricing page views, demo requested
Behavioral signals often predict intent better than demographics alone. A VP at a target-account company who has visited your pricing page twice is a fundamentally different lead than the same VP who only read a top-of-funnel blog post.
Sales and marketing alignment on qualification criteria is non-negotiable. Define together: what score triggers an MQL, what additional criteria promote an MQL to SQL, and who owns the lead at each stage. Without a shared definition, qualified leads get dropped and unqualified ones consume sales capacity.
Accelerate Your Response Time to Leads
When a prospect fills out a form, their interest is at its peak. Every hour that passes erodes it.
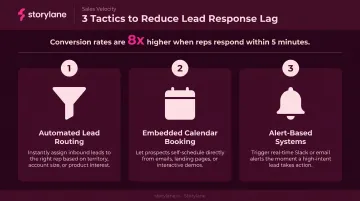
InsideSales research across 50M+ sales interactions found conversion rates are 8x greater when reps respond within the first five minutes. The foundational MIT study puts it even more starkly: contact odds are 100x higher and qualification odds 21x higher at five minutes versus thirty.
Practical tactics to eliminate response lag:
- Automated lead routing — connect qualified leads to the right rep immediately after form submission, not through a manual triage queue
- Embedded calendar booking — add a scheduling option directly in the post-form confirmation page so prospects can book without waiting for outreach
- Alert-based systems — Slack or email notifications triggered the moment a prospect engages with a key asset (a pricing page, a demo, a case study)
The goal isn't just fast response — it's contextual fast response. A rep who follows up knowing what the prospect just viewed will have a more productive first conversation than one working from a cold form fill.
Build a Lead Nurturing Program Tied to Buyer Behavior
Half your leads aren't ready to buy at first contact. That's not a problem — it's an opportunity, if you have a nurture program that keeps them moving forward.
Generic email blasts don't move leads. Behavior-triggered sequences do. The mechanics:
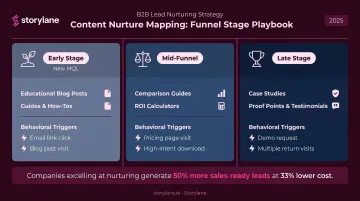
- Segment by lifecycle stage — a new MQL needs different content than an SQL who requested a demo six weeks ago
- Map content to stage: educational posts for early-stage leads, comparison guides and ROI calculators for mid-funnel, case studies for late-stage
- Trigger sequences on specific actions: returning to the pricing page, clicking a product link in an email, downloading a high-intent resource
The behavioral trigger is what distinguishes nurturing from broadcasting. When a prospect returns to your pricing page, that's a signal — and the next touchpoint should reflect it, not ignore it.
A well-structured nurture program also compounds over time. Companies that excel at lead nurturing generate 50% more sales-ready leads at 33% lower cost, according to Forrester research — a meaningful efficiency gain as pipeline scales.
Use Interactive Product Demos to Convert Leads Earlier
Most prospects arrive at a sales call cold — they've seen your website and maybe a one-pager, but they haven't experienced the product. Interactive demos change that dynamic.
When prospects can explore your product on their own before speaking to a rep, they arrive at the call already oriented — with specific questions instead of generic ones. Show rates improve because they've already invested time. Sales cycles shorten because the education phase is largely complete.
Gartner reports that 75% of B2B buyers prefer a rep-free sales experience — interactive demos meet that preference while still feeding qualified, engaged leads to your sales team.
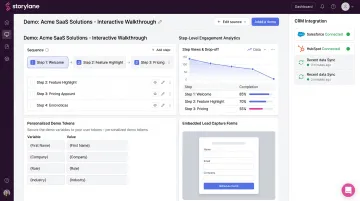
Storylane is built specifically for this use case. Teams use it to create interactive demos prospects can explore independently, with several capabilities that directly affect conversion:
- Personalization at scale — dynamic tokens for prospect name, company name, logo, and even business metrics like revenue figures, so each demo feels purpose-built for that account
- Engagement analytics — step-level tracking showing where prospects spend time, where they drop off, and what their intent score is, surfaced via Slack alerts and synced to Salesforce and HubSpot
- Embedded lead capture — custom forms inside the demo flow that route directly to CRM, so no lead data is lost
- Account Reveal — identifies anonymous demo visitors by company before they fill out a form
PDQ ran an eight-month A/B test using Storylane demos and found that visitors who viewed their interactive product tour converted at 6.14% versus 3.19% without it — a 92% lift that held consistently over time, not as a one-time spike.
Add Social Proof Strategically Throughout the Funnel
Prospects aren't looking for generic five-star reviews. They're looking for evidence that someone like them has succeeded with your product.
Deploy proof points based on where in the funnel the prospect is:
- Landing pages: Customer logos and aggregate review ratings establish credibility fast
- Demo request pages: Specific testimonials with metrics (not just quotes) — "We reduced onboarding time by 40%" outperforms "Great product!"
- Sales outreach sequences: Detailed case studies matched to the prospect's industry, company size, or use case
The matching principle matters more than most teams realize. A manufacturing prospect converts better when they see a manufacturing customer's results. A 200-person company relates more to a peer-sized company's outcome than a Fortune 500 case study.
Segment your proof points by vertical, company size, and use case — then deploy the relevant one based on what you know about the lead.
Reduce Friction at Every Stage of the Conversion Path
Friction kills conversions quietly. A slow-loading page, a six-field form, unclear next steps — each one creates an exit point for a prospect who was otherwise interested.
Start with an audit: map every touchpoint in your current buyer journey and identify where leads are dropping off using available analytics. Common friction points include:
- Overly long lead capture forms — use data enrichment tools to pre-fill firmographic fields so prospects only enter what you genuinely can't get elsewhere
- Multiple competing CTAs — every high-intent page should have one clear next step, not three
- Scheduling back-and-forth — embedding direct calendar booking into emails and landing pages removes a conversion step that loses a meaningful percentage of prospects
Chili Piper's 2025 benchmark report found that only 10.3% of demo form fills result in a booked demo — based on 4 million form submissions. That means roughly 90% of prospects who expressed enough interest to fill out a form never actually show up. Friction is a primary reason.
Aligning Sales and Marketing for Higher Conversion
Misalignment between sales and marketing is one of the most reliable causes of conversion leakage — and one of the least visible until you look for it.
The symptoms are familiar: sales ignores marketing leads because they're "unqualified," marketing questions why sales isn't following up, and no one agrees on what a qualified lead actually is. Meanwhile, leads fall through the cracks at the handoff.
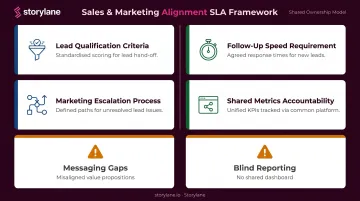
A shared Service Level Agreement (SLA) fixes the structural problem by defining:
- Exactly what criteria qualify a lead for handoff
- How quickly sales must follow up on an MQL
- What marketing does if a lead isn't followed up within that window
- Which metrics both teams are accountable to
Two more failure modes undermine alignment even after an SLA is in place:
- Messaging gaps: Prospects who see marketing content built around one value proposition, then get a sales pitch focused on something else, lose confidence fast. A standing monthly review of email sequences, demo scripts, and collateral keeps both teams telling the same story — no major initiative required.
- Blind reporting: Without a shared dashboard showing lead volume, conversion rate by source, and pipeline velocity, neither team can pinpoint which stage or channel is losing leads. That visibility enables targeted fixes rather than sweeping process changes that disrupt what's working.
Tracking, Testing, and Optimizing Over Time
Conversion improvement isn't a one-time project. It's a continuous testing process that compounds over time.
The framework is straightforward:
- Identify one variable — form length, CTA copy, follow-up timing, demo placement
- Run the change against current performance for a defined period
- Measure results before scaling or discarding
- Move to the next variable
Changing multiple things simultaneously makes it impossible to know what actually worked.
The impact of systematic testing is real. VWO documented a case with WorkZone, a project management software company, that increased form submissions by 34% through a focused A/B test — a meaningful conversion gain from a single, well-measured change.
For teams using interactive demos, Storylane's analytics add a behavioral layer that standard A/B testing misses. Step-level engagement data — which screens attracted attention, where prospects dropped off, which features drove the most time-on-screen — gives teams account-specific signals, not just aggregate rates.
A prospect who spent significant time on a particular feature but abandoned the demo at a specific step is telling you something. The follow-up should reflect that, not ignore it.
Teams that pair quantitative A/B results with behavioral demo signals move faster — they know not just what to change, but which prospects to prioritize next.
Frequently Asked Questions
What is a lead conversion?
Lead conversion is the process of turning a prospect who has shown interest into a paying customer. It encompasses all marketing, sales, and nurturing activities that move a lead from initial contact through to a closed deal.
What is a good lead conversion rate?
It depends on industry and how you define the conversion event. Software averages around 7.6% overall, while B2B SaaS website-to-lead conversion sits closer to 1.1%. Your own historical baseline is a more useful benchmark than industry averages — track your rate consistently, then measure improvement against it.
What is the cost per lead conversion?
Cost per lead conversion is your total sales and marketing spend divided by the number of leads that became customers in a given period. It reveals whether your conversion investment is generating profitable returns or simply increasing volume without improving economics.
How do I calculate my lead conversion rate?
Divide the number of converted leads by your total leads, then multiply by 100. Before you calculate, define what "converted" means (stage progression, meeting booked, or closed deal), since each produces a different and incomparable result.
What is the difference between lead generation and lead conversion?
Lead generation attracts and captures prospects' interest, filling the top of the funnel. Lead conversion is the work of guiding those prospects through until they become paying customers. Each phase requires distinct strategies, different metrics, and often separate team ownership.
How do interactive product demos improve lead conversion?
Interactive demos let prospects explore the product at their own pace before speaking to a rep. That self-guided familiarity shortens the education phase, produces warmer sales conversations, and improves show rates, since prospects arrive with specific questions rather than starting cold.