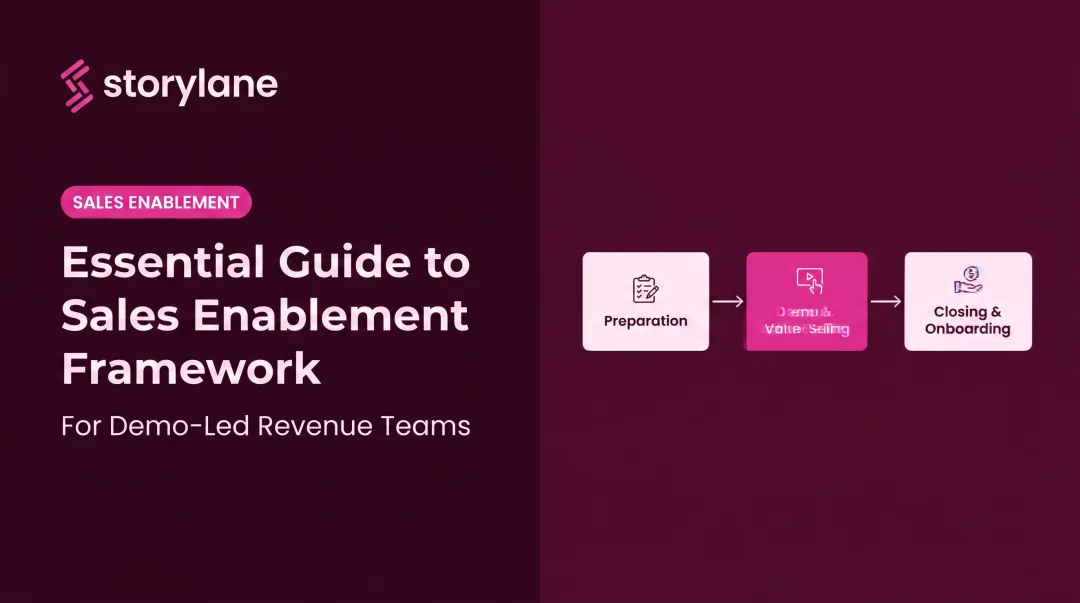
Introduction
Sales leaders today have more data than ever — and less clarity about what actually matters. With dashboards full of numbers, it's easy to confuse activity with progress. Teams look busy, pipelines look full, but quota attainment tells a different story.
According to Salesforce, only 24.3% of salespeople exceed their yearly quota. Most of the time, the culprit isn't pipeline volume or headcount — it's measurement. When teams track the wrong metrics, or track too many, they lose sight of the numbers that actually drive revenue.
This guide covers what sales performance metrics are, how they differ from KPIs, which ones every team should track, and how to act on that data. Whether you're a rep chasing quota or a CRO building a forecasting model, you'll come away with a tighter, more actionable set of numbers to work from.
Key Takeaways
- Sales metrics measure activity and outcomes; KPIs attach specific business goals to those metrics
- Leading indicators (calls, demos, pipeline coverage) predict future performance; lagging indicators (win rate, revenue) measure what's already happened
- The most important metrics vary by role — reps, managers, and executives each need a different view
- Demo engagement quality is a stronger buying signal than raw activity volume
- Metrics only drive results when they're tied to coaching decisions and process changes
What Are Sales Performance Metrics — and How Do They Differ from KPIs?
Sales performance metrics are quantifiable data points that measure how effectively a rep, team, or organization converts activity into revenue. They span the full funnel — from calls made to deals closed to customers retained.
The distinction between metrics and KPIs trips up a lot of teams. Here's the simplest way to think about it:
- Metrics track what's happening — conversion rate, average deal size, calls made
- KPIs attach a specific goal to a metric — "increase demo-to-close conversion from 18% to 25% by Q3"
All KPIs are metrics. Not all metrics are KPIs. The gap between them is a specific target tied to a business decision.
How to Decide Which Metrics Belong on Your Dashboard
Tracking more metrics rarely produces better decisions. When a number isn't tied to a revenue goal, it becomes noise. Each metric on your dashboard should answer a question that someone is actually making decisions about. If no one is using a number to coach, forecast, or adjust strategy, it doesn't belong on the dashboard.
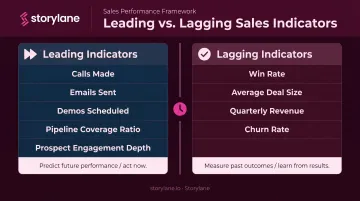
Leading vs. Lagging Indicators: Why the Difference Matters
Most sales teams track the wrong metrics — not because they're measuring too little, but because they're measuring too late.
Leading indicators are forward-looking. They signal where your pipeline is heading while you still have time to act:
- Calls made and emails sent
- Demos scheduled and held
- Pipeline coverage ratio
- Prospect engagement depth
Lagging indicators measure what has already happened — outcomes you can learn from, but can no longer change:
- Win rate
- Average deal size
- Quarterly revenue
- Churn rate
Gartner classifies leading indicators as predictive metrics that measure seller activity — including lead response time, interaction quality, and sales cycle time. Lagging indicators describe historical outcomes: deal count, win rate, and revenue attainment.
Neither type alone is sufficient. Lagging indicators tell you whether your strategy worked. Leading indicators tell you whether it's working right now — early enough to course-correct before a bad quarter becomes official.
Essential Sales Metrics Every Team Should Track
Effective sales measurement covers three categories: activity metrics, performance and revenue metrics, and customer and retention metrics. Together they provide a full-funnel view of sales health.
Sales Activity Metrics
Activity metrics are the leading indicators that reveal whether reps are generating enough pipeline volume to hit targets. The foundational ones to track:
- Calls made and emails sent — raw outreach volume
- Follow-ups completed — persistence matters; RAIN Group found it takes an average of 8 touchpoints to secure a first meeting with a new prospect
- Proposals submitted — pipeline progression signal
- Demos held — one of the strongest intent indicators in B2B sales
The challenge: reps spend just 28% of their week actually selling, with the rest consumed by administrative tasks and deal management. Activity metrics help managers see whether reps have enough selling capacity to hit targets — and where time is being lost.
Beyond raw counts: demo engagement quality
Counting demos held is a start. Knowing what happened during those demos is where the real signal lives. Modern teams track which features prospects explore, how long they spend on each section, where they drop off, and whether they return for a second viewing.
Storylane's analytics platform captures this behavioral data — completion rates, drop-off points, feature exploration patterns, and return visits — and aggregates it into automatic Low/Medium/High intent scoring. Reps can prioritize outreach based on real interest, not just attendance. That intent data pushes directly into HubSpot, Salesforce, and other CRM platforms, adding a behavioral layer to standard pipeline data.
Sales Performance and Revenue Metrics
Win rate and conversion rate
Win rate measures closing effectiveness: deals won ÷ total quoted opportunities. RAIN Group's 2026 survey of 472 sellers found the average win rate at the proposal stage is 47%, with Elite Performers closing 73% of deals versus 40% for the bottom 80%.
Conversion rate tracks the percentage of leads that become paying customers. Together, these two metrics expose where deals stall — whether the problem is in qualification, pitch quality, or proposal timing.
Average deal size and sales cycle length
| Metric | Formula | What It Reveals |
|---|---|---|
| Average deal size | Total revenue ÷ closed-won deals | Forecast accuracy, upsell potential |
| Sales cycle length | Sum of days to close ÷ number of deals | Process bottlenecks, slippage risk |
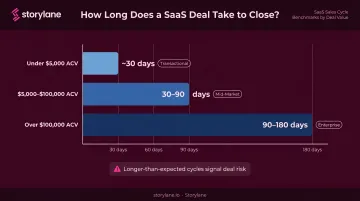
Sales cycle length benchmarks vary significantly by deal value. SaaStr data shows deals under $5,000 ACV typically close in around 30 days, while deals over $100,000 ACV can take 90–180 days. Longer-than-expected cycles are often the first sign of a deal at risk.
Quota attainment and pipeline coverage
Quota attainment = (revenue closed ÷ rep's quota) × 100. When fewer than one in four reps hit their number, the issue may be unrealistic targets, insufficient resources, or both — not individual rep effort.
Pipeline coverage = total pipeline value ÷ revenue target. HubSpot recommends a 3:1 to 5:1 ratio for healthy pipeline coverage. Below 3:1, there's not enough opportunity volume to absorb deal slippage.
Customer and Retention Metrics
CLV and churn rate
Customer Lifetime Value (CLV) = (ARPA × Gross Margin) ÷ Customer Churn Rate. It guides decisions on how much to spend acquiring and retaining customers.
Churn rate measures the percentage of customers lost in a given period. It's a lagging indicator — by the time it appears in the data, the dissatisfaction already happened. For SaaS companies, ChartMogul's benchmark data shows median monthly churn runs around 6.5% for companies under $300K ARR, dropping to 3.1% for companies above $8M ARR.
NRR and upsell/cross-sell rate
Net Revenue Retention (NRR) measures revenue retained from existing customers after accounting for expansions, downgrades, and cancellations. An NRR above 100% means existing customers are generating more revenue than before — even without adding new ones.
Bessemer Venture Partners classifies NRR as follows:
- 100% — Good
- 110% — Better
- 120%+ — Best-in-class
For early-stage SaaS companies ($1M–$10M ARR), best-in-class NRR is 145%+. Upsell and cross-sell rate measures how effectively account teams expand existing relationships — one of the highest-ROI activities in any SaaS business.
How to Prioritize Metrics by Role
The "right" metrics depend entirely on who's reviewing them and what decisions they're making.
| Role | Priority Metrics |
|---|---|
| Sales Reps | Quota attainment, win rate, average deal size, pipeline coverage |
| Sales Managers | Conversion rate by stage, deal slip rate, pipeline coverage, sales cycle length |
| Sales Operations | Forecast accuracy, sales cycle length, process efficiency ratios |
| Sales Executives / CROs | ARR, NRR, CLV, churn rate, overall quota attainment |
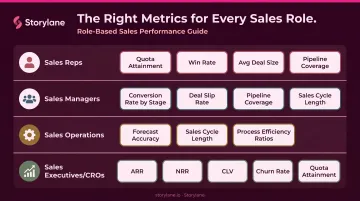
The key principle: each stakeholder should have a focused dashboard with 3–5 metrics directly tied to their decision-making authority. Giving a rep a churn dashboard or a CRO a calls-per-day chart creates confusion, not insight. More metrics don't mean more clarity. They usually mean less.
How to Track and Act on Sales Metrics
Tracking metrics well is a data infrastructure problem before it's a strategy problem.
Start With Data Quality
Before building dashboards, verify that activity data is actually being captured where work happens:
- Call and email data from sales engagement platforms and dialers
- Demo engagement data from tools like Storylane — including completion rates, feature exploration, and intent scores
- Deal-stage data logged consistently in the CRM
Inconsistent logging is the most common reason dashboards become unreliable. Garbage in, garbage out.
Centralize in a CRM Dashboard
Connecting sales tools to a CRM creates a single source of truth where leading and lagging indicators can be viewed side by side. When Storylane's demo engagement data flows into Salesforce or HubSpot, reps don't need to check a separate platform to know a prospect just spent 15 minutes re-watching the pricing section of a demo.
That signal, pushed via real-time Slack alert, gives them the right context to follow up immediately — while buying intent is highest.
Establish a Review Cadence
- Daily/weekly: Calls made, emails sent, demos held, pipeline coverage — leading indicators that allow real-time course correction
- Monthly/quarterly: Win rate, revenue, churn, NRR — lagging indicators reviewed in performance cycles
The cadence determines how quickly the team can respond. A team reviewing pipeline coverage monthly can't catch a coverage gap before it becomes a quota miss.
Turn Data Into Action
Metrics are only valuable if they change behavior. For instance:
- Conversion rate drops at the proposal stage → investigate whether reps are pitching before adequate qualification
- Sales cycle length increases → look for contract approval bottlenecks or deal committee expansion
- Demo engagement data shows prospects dropping off at the same feature walkthrough → rebuild that section
The goal is a feedback loop where data drives coaching decisions, and better coaching produces measurable movement in the metrics.
Frequently Asked Questions
What are sales metrics?
Sales metrics are quantifiable data points used to measure the performance and activities of a sales rep, team, or organization over a given period. They cover everything from calls made to revenue generated to customer retention rates.
What is the difference between sales metrics and sales KPIs?
All KPIs are metrics, but not all metrics are KPIs. KPIs are the subset tied to a specific business goal — for example, hitting $200K in monthly recurring revenue. Metrics track a broader range of activities and outcomes, many of which inform strategy without being tied to a formal target.
What are the most important sales performance metrics to track?
The most universally tracked metrics include conversion rate, win rate, average deal size, sales cycle length, quota attainment, and customer lifetime value. The "most important" set depends on a company's stage, sales model, and current priorities.
How do leading and lagging indicators differ in sales?
Leading indicators — pipeline coverage, calls made, demos scheduled — predict future performance and allow early intervention. Lagging indicators — win rate, revenue, churn — measure outcomes that have already occurred. Tracking both gives you the ability to course-correct before results suffer.
How often should sales metrics be reviewed?
Activity-based leading indicators should be reviewed daily or weekly so adjustments can be made quickly. Outcome-focused lagging indicators like revenue and win rate are typically reviewed monthly or quarterly during performance reviews.
What tools are used to track sales metrics?
CRM platforms like Salesforce and HubSpot are the central hub for most sales metrics. Supplementary tools such as sales engagement platforms, dialers, and demo analytics tools like Storylane feed activity and engagement data directly into the CRM, giving teams a unified view of buyer behavior and rep performance.