Key Takeaways
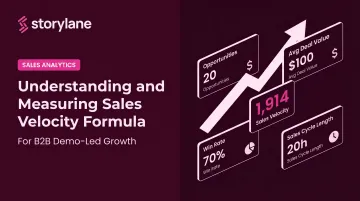
- Sales Velocity = (Opportunities × Deal Value × Win Rate) ÷ Sales Cycle Length — expressed as revenue generated per day
- All four variables are levers: improving any single one increases velocity
- Sales cycle length has the highest single-lever impact — cutting it boosts velocity even when nothing else changes
- Segment velocity by deal size (SMB, mid-market, enterprise) — a blended number hides serious problems
- Interactive, self-serve demos directly compress cycle length — prospects arrive primed, and deals close faster
What Is Sales Velocity?
Sales velocity measures how quickly prospects move through your pipeline and convert into revenue — expressed as a dollar amount generated per unit of time, typically per day.
Most sales metrics measure what happened: closed revenue, win rate, average deal size. Sales velocity measures how fast it's happening — which turns your pipeline into something you can actually forecast with.
According to Salesforce, sales velocity captures the rate at which leads progress through the funnel, generally measured by revenue generated in a specific period. HubSpot defines it simply as how quickly deals move through the pipeline and generate revenue.
Three distinctions that come up often:
- Sales velocity, pipeline velocity, and sales funnel velocity are the same concept. The naming convention varies by company and tool, but the formula and intent are identical.
- Sales velocity is not win rate, growth rate, or run rate. It synthesizes all four pipeline inputs — opportunities, deal value, win rate, and cycle length — into a single health score.
- Track it over 6–12 months, not just one quarter, to filter out seasonal noise and spot real trends.
The Sales Velocity Formula: Breaking Down the 4 Variables
The formula, as defined by both Salesforce and HubSpot, is:
Sales Velocity = (Opportunities × Average Deal Value × Win Rate) ÷ Sales Cycle Length
The numerator captures your pipeline's revenue potential. The denominator converts it into a rate, which is what separates velocity from a simple revenue total.
Number of Opportunities
This is the count of sales-qualified leads in your pipeline during the measurement period — not raw leads, not MQLs, not everyone who downloaded a whitepaper.
Inflating this number with low-quality leads is the most common mistake in the formula. It makes your velocity look higher on paper while masking a win rate problem underneath. Tighter qualification criteria, not higher volume, is what moves the needle.
A Forrester case study on Palo Alto Networks found that opportunities with multiple stakeholders attached were 8x more likely to advance in the pipeline — a strong argument for qualification that goes beyond individual contact capture.
Average Deal Value
Divide total revenue for the period by the number of deals closed. For SaaS businesses with recurring revenue, Customer Lifetime Value (CLV) can substitute for single-deal value to capture the full revenue picture more accurately.
Win Rate
Win rate = deals won ÷ total opportunities. It's directly tied to lead quality — tighten your qualification criteria and win rate almost always follows.
The Bridge Group's 2024 SaaS AE report, based on 172 B2B SaaS companies, breaks down median win rates by deal size:
- 19% median across all deal sizes
- 24% for sub-$5K ACV deals
- 17% for $50K+ ACV deals
Larger deals come with more stakeholders, longer evaluation cycles, and stricter scrutiny — all of which compress win rates.
Sales Cycle Length
The average number of days from a qualified opportunity to closed-won. This is the only variable you want to decrease. A shorter cycle means higher velocity even if the other three numbers stay flat, making it the most actionable single lever for most teams.
Sales Velocity in Action: A Worked Example
Take a fictional SaaS company with these inputs:
| Variable | Value |
|---|---|
| Number of Opportunities | 120 |
| Average Deal Value | $2,500 |
| Win Rate | 25% |
| Sales Cycle Length | 45 days |
Calculation:
(120 × $2,500 × 0.25) ÷ 45 = $1,667/day
Over a 90-day quarter, that translates to roughly $150,000 in projected revenue. A sales manager looking at this number knows the pipeline is generating revenue at a steady rate — and has a baseline to measure improvement against.
The Lever Effect
Now watch what happens when you change just one variable:
| Change | New Velocity | Impact |
|---|---|---|
| Baseline | $1,667/day | — |
| Shorten cycle from 45 → 30 days | $2,500/day | +50% |
| Raise win rate from 25% → 30% | $2,000/day | +20% |
| Add 20 more opportunities (120 → 140) | $1,944/day | +17% |
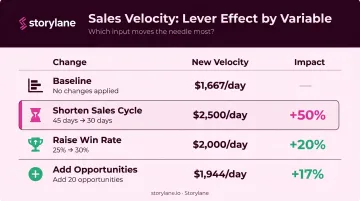
Shortening the cycle from 45 to 30 days — without touching anything else — delivers a 50% velocity increase. That's the lever effect in action, and it's why cycle length deserves disproportionate attention.
The Segmentation Problem
Here's where most teams go wrong: they calculate one blended velocity number across all deal types.
A $2,000 SMB deal with a 30-day cycle behaves completely differently from a $50,000 enterprise deal with a 150-day cycle. Average them together and you get a number that obscures problems in both segments.
The Bridge Group's research bears this out: B2B SaaS win rates range from 24% for sub-$5K ACV deals to 17% for $100K+ deals, and cycle lengths stretch from 1.3 months to 7.1 months across those same bands. The practical implication:
- Calculate velocity separately for SMB, mid-market, and enterprise
- Never let a strong SMB pipeline mask a stalling enterprise segment
- Set improvement targets (win rate, cycle length) at the segment level, not company-wide
How to Increase Your Sales Velocity
Since velocity is a formula, improvement strategies map directly to its four inputs. Don't try to move all four simultaneously — identify where your biggest gap is and start there.
Increase the Number of Quality Opportunities
Fewer high-quality leads outperform a bloated pipeline of low-intent prospects. Focus on pipeline quality, not volume:
- Tighten lead qualification criteria so only sales-ready opportunities enter the count
- Use intent signals and engagement data to prioritize outreach
- Remove stale opportunities — dead weight hurts every number in the formula
- Target buying groups, not just individual contacts (the Palo Alto Networks case study above is worth revisiting here)
Grow Your Average Deal Value
Larger deals require genuine buyer value to justify the investment — forced upsells backfire.
- Uncover deeper pain points before proposing scope (bigger problems justify bigger solutions)
- Introduce upsell and cross-sell options at the right stage, not reflexively at the start
- Bundle complementary services in ways that reduce friction rather than add complexity
Improve Your Win Rate
Win rate improves when the right prospects are in the pipeline and the right people are involved early.
- Bring decision-makers into conversations earlier — according to Forrester, 68% of B2B buyers already have a front-runner at the start of a purchase, and that vendor wins 80% of the time.
- Remove prospects with unavoidable blockers rather than carrying them as false positives
- Follow up with relevant, personalized outreach — Gartner data shows irrelevant outreach causes 73% of B2B buyers to actively avoid suppliers
Shorten Your Sales Cycle
This is where the biggest gains live. Practical tactics:
- Automate repetitive tasks so reps spend time on conversations, not admin (Salesforce reports sales professionals spend 60% of their time on non-selling tasks)
- Establish a clear next step after every interaction — no open-ended "I'll follow up sometime next week"
- Surface pricing early; TrustRadius research found 72% of buyers are more likely to purchase when pricing is transparent
- Give prospects hands-on product access before — or instead of — a traditional demo call
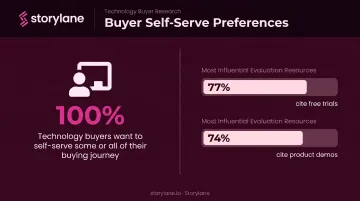
That last point deserves emphasis. Virtually 100% of technology buyers want to self-serve some or all of their buying journey — with 77% citing free trials and 74% citing product demos as their most influential evaluation resources.
The more a prospect understands your product before the first sales call, the faster they move through evaluation. Tools like Storylane let teams deploy interactive demos that buyers can explore on their own schedule, so the first live conversation starts from a position of real familiarity rather than a cold introduction.
How Storylane Helps Shorten the Sales Cycle and Win More Deals
Storylane's interactive demo platform targets the two velocity levers that move the needle most: sales cycle length and win rate.
Pre-Call Self-Education That Compresses Evaluation Time
When a prospect can experience a personalized, interactive product demo before the first sales call, they arrive already informed. Storylane's Buyer Hubs let prospects self-navigate through demos organized by use case, role, or feature set — exploring pricing, competitor comparisons, and feature walkthroughs on their own terms, at their own pace.
The result is a discovery call that skips the product tour entirely and goes straight to the specific questions the prospect already has. As one Campminder sales manager put it: "Prospects see the product. We skip over the discovery, and jump straight into a high-intent demo. Time saved for buyers and sellers."
ContactMonkey reported a 3x improvement in sales velocity after implementing Storylane demos, with a demo-to-opportunity conversion rate of 28% — roughly 2x better than other inbound sources.
Deal Intelligence That Drives Smarter Follow-Up
Storylane's engagement analytics track time spent per demo step, feature-level exploration, drop-off points, and CTA clicks. Reps receive real-time Slack alerts the moment a high-intent prospect engages, with full context on exactly what they viewed.
That visibility translates directly into win rate gains — reps follow up with relevant, personalized outreach based on what the prospect actually explored, rather than firing off generic sequences. The Account Reveal feature adds another layer, de-anonymizing demo visitors with company-level firmographic data so reps know which accounts are actively evaluating before picking up the phone.
CRM Integration Keeps Velocity Calculations Current
Demo engagement data syncs directly into your CRM, keeping pipeline velocity tracking accurate without manual data entry. Storylane is the only interactive demo tool with native CRM apps for both Salesforce and HubSpot. That means:
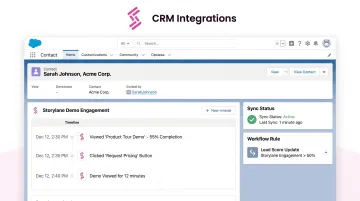
- Reps send personalized demos from inside their existing CRM workflow
- Engagement data — views, clicks, drop-offs — syncs back automatically
- Pipeline velocity metrics reflect real buyer behavior, not stale estimates
- No separate data export or manual update required
Sales velocity improves when every variable is measured and every friction point is addressed. Storylane gives revenue teams the data and the tools to do both — continuously.
Frequently Asked Questions
What is an example of sales velocity?
A team with 100 opportunities, $1,500 average deal value, 20% win rate, and a 30-day cycle has a velocity of $1,000/day — roughly $90,000 in projected revenue over a 90-day quarter. That single number tells the sales manager how much revenue the current pipeline should generate if nothing changes.
What is a good sales velocity number?
There is no universal benchmark. A good velocity number is one that is increasing relative to your own historical baseline. Compare period-over-period within your own pipeline segments rather than against industry averages, which vary too widely by deal size and market to be actionable.
What is the difference between sales velocity and pipeline velocity?
The terms are interchangeable — both use the same four-variable formula and measure how quickly prospects generate revenue. Which term you use depends on the tool or team — there's no difference in calculation or intent.
Which variable in the sales velocity formula has the biggest impact?
Sales cycle length — the denominator — has an outsized effect. Reducing it increases velocity even if the other three variables hold constant, as the worked example above shows: cutting cycle length from 45 to 30 days produces a 50% velocity gain.
How often should I calculate sales velocity?
At minimum, quarterly — monthly for fast-moving pipelines. A 6–12 month measurement window smooths seasonal variation and produces a more reliable trend line than any single quarter.
Can sales velocity be used for sales forecasting?
Yes. Multiply your daily velocity by the number of days in the target period to get a projected revenue figure. Combine it with pipeline stage conversion data to confirm whether the current pipeline can realistically hit that number.