Quick summary
A Gantt chart in Smartsheet lets project managers visualize task timelines and dependencies in a structured, easy-to-read format. You can create one in minutes by selecting the built-in Gantt sheet type and entering your project data directly into the grid.
Steps
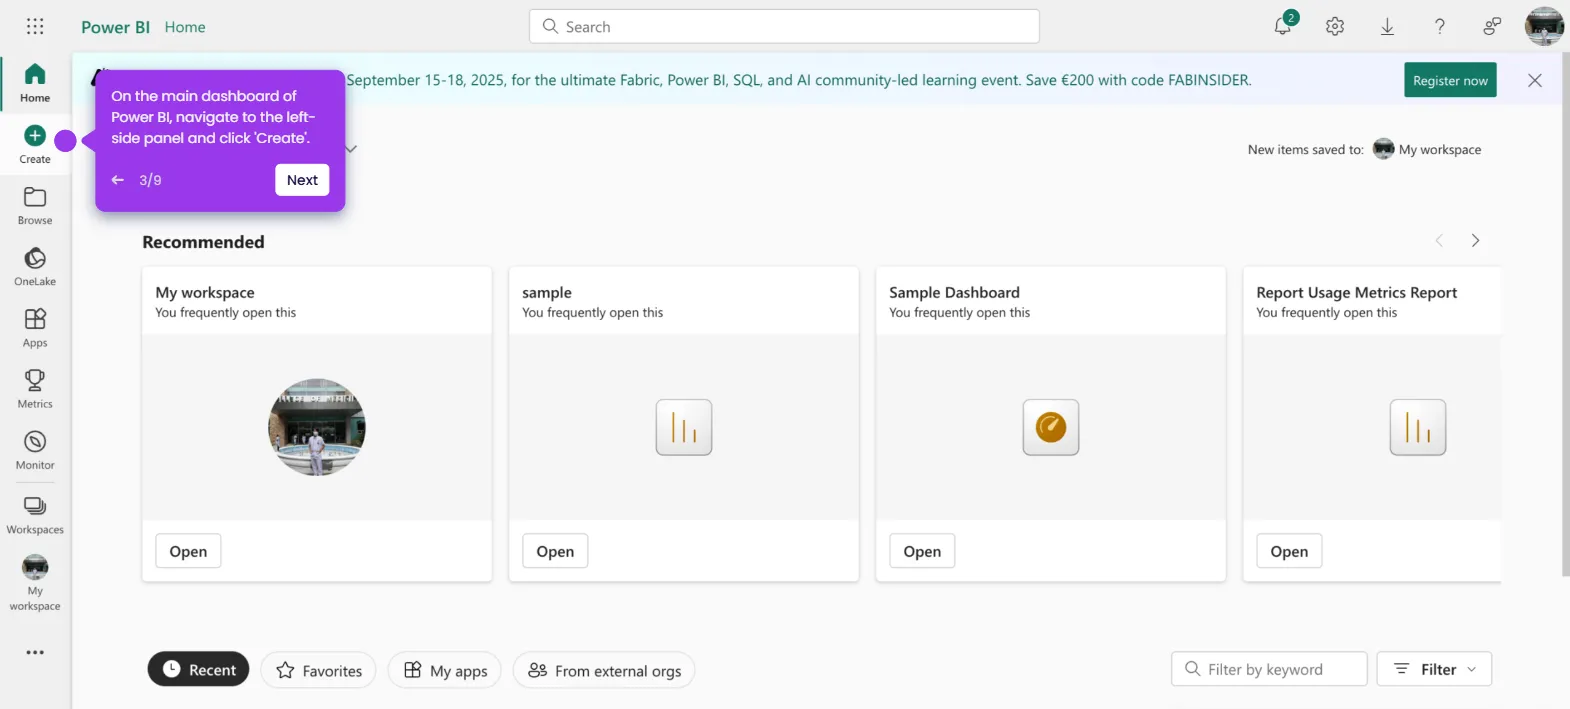
- On Smartsheet's main dashboard, find and select a workspace under All Workspaces.
- Go to the left-side panel and click Add.
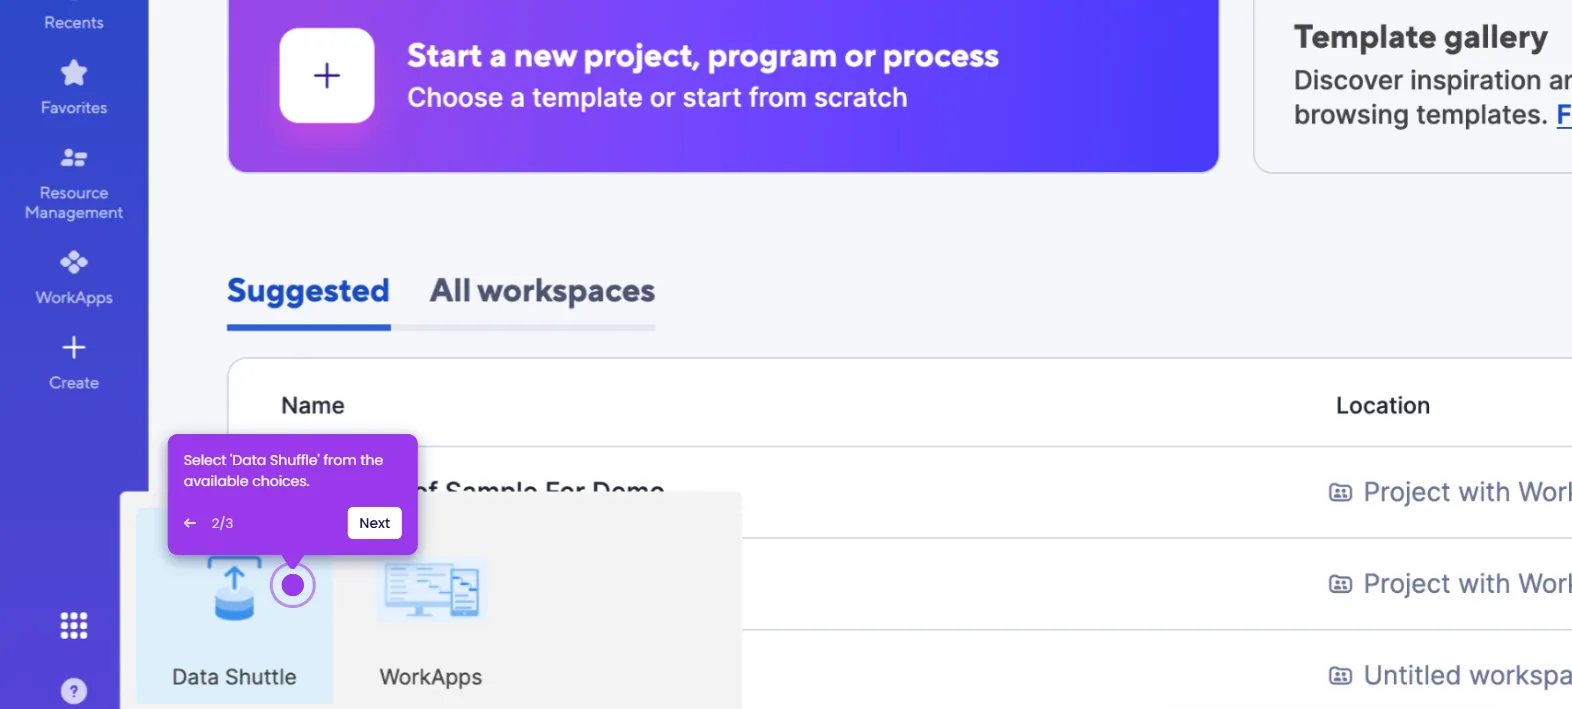
- Hover over the Sheet option, then select Gantt.
- Enter a unique name for your Gantt chart in the input field provided.
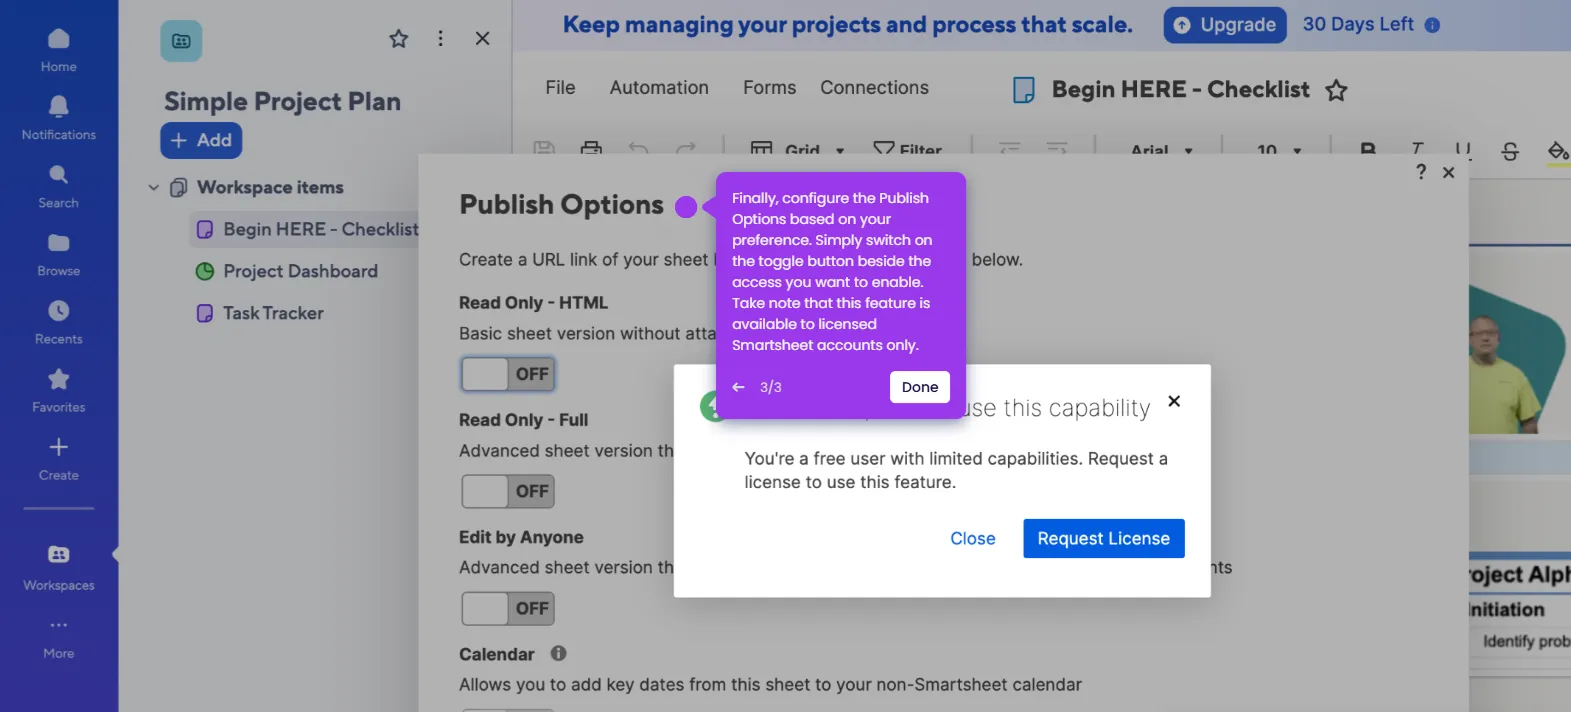
- Replace the placeholder text fillers with your actual task data, typing each entry into its respective cell.
- Your Smartsheet Gantt chart is now created based on your input.