Quick summary
Coda lets you create interactive dashboards by combining tables, charts, and progress trackers inside a single doc. This step-by-step walkthrough shows you how to set up and customize a Coda dashboard with multiple views and data visualizations.
Steps
- Go to your Coda account and click '+ Blank doc' to start a new document.
- Give your doc a meaningful title to organize your work.
- Add a cover to make your doc visually appealing and professional.
- Click 'Upload image' to add a cover photo to your doc.
- Click the add icon to begin inserting content blocks into your doc.
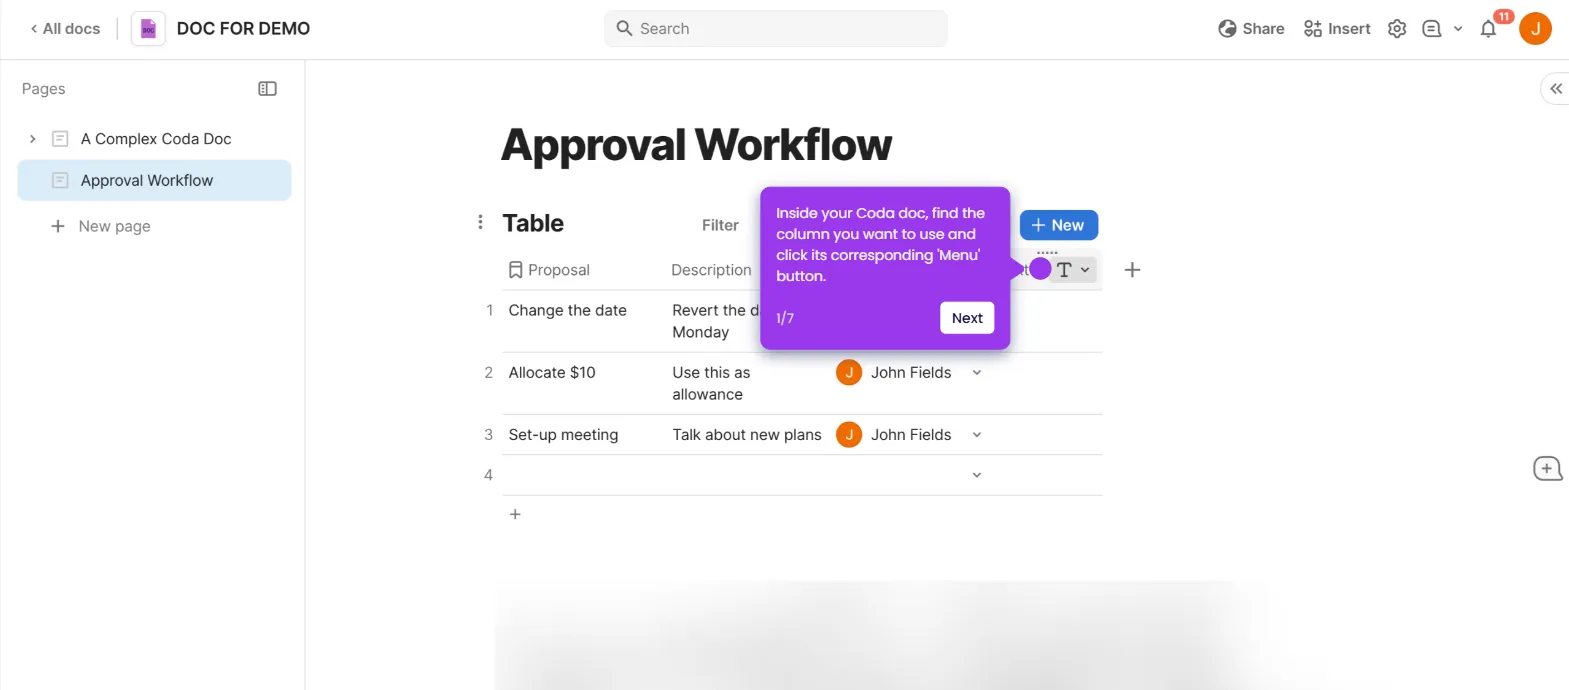
- Insert a table to organize and structure your data effectively.
- Customize your table by adding relevant data for your project.
- Click the add icon again to add different views to your dashboard.
- Select and add a line chart to visualize trends and patterns in your data.
- Create a custom chart using 'Start blank' to perfectly fit your data visualization needs.
- Add a progress tracker to monitor project status and achievements.
- Customize your progress indicator to reflect your specific workflow stages.
- Your interactive dashboard in Coda is now complete and ready to use.