Quick summary
Coda lets you create charts directly inside any doc by inserting a chart block and linking it to an existing table or view. This makes it easy to visualize data without leaving your workspace or switching to a separate tool.
Steps
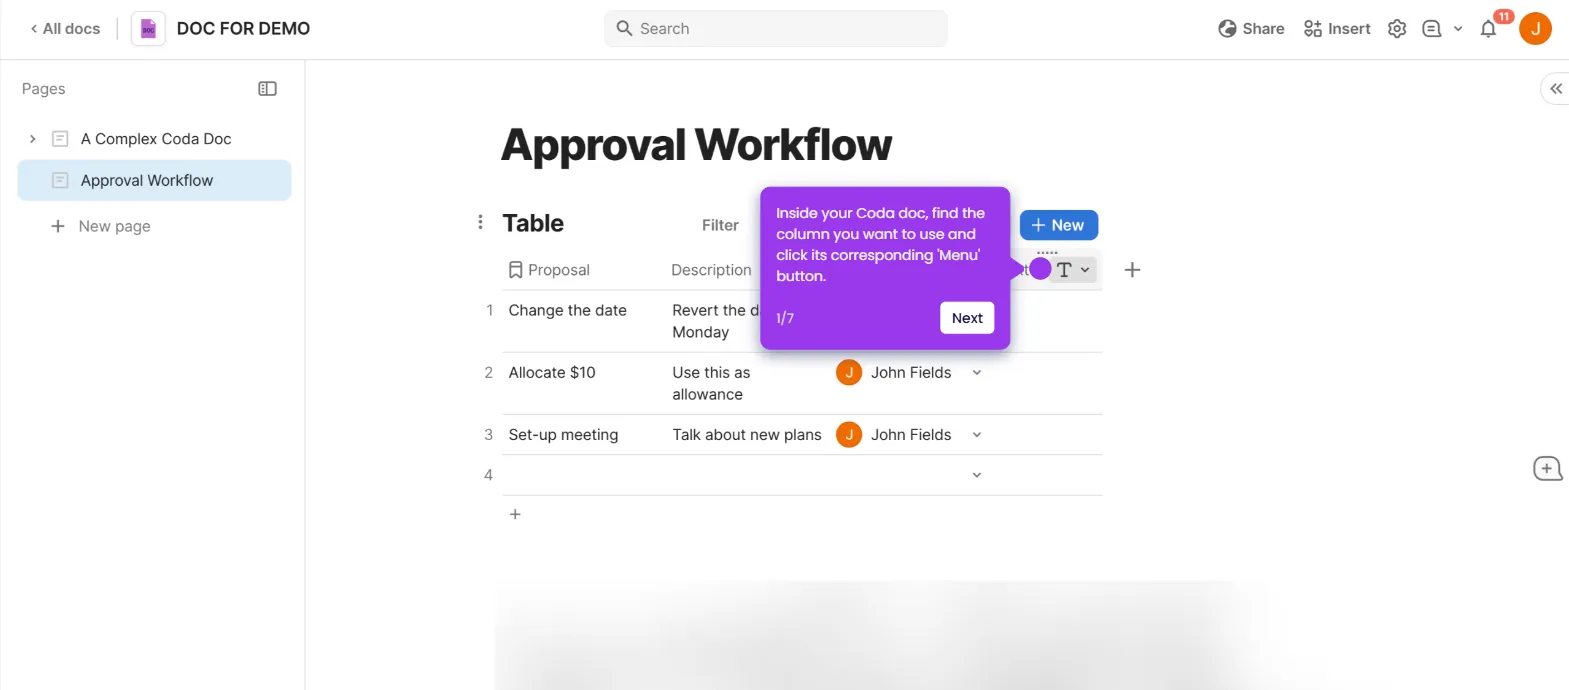
- On any blank line in your Coda doc, click the add icon or type /chart to open the insert menu.
- Select 'Chart' from the menu options.
- Choose the table or view you want Coda to use to build the chart.
- Your data is now visualized — follow these steps any time to quickly create a chart from your Coda tables.