Here’s how to do it:
- Open your project in Microsoft Project file.
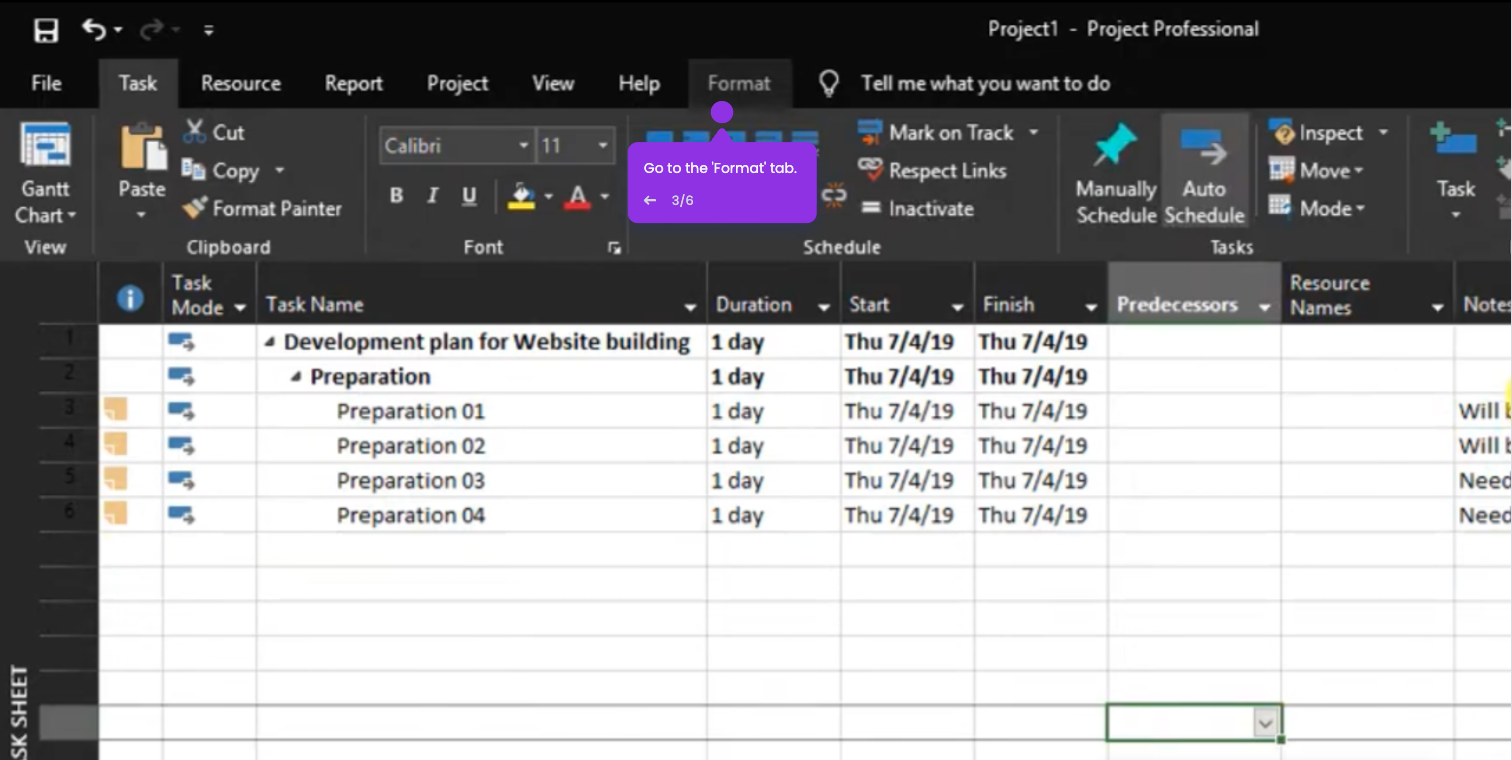
- Go to the 'View' tab on the ribbon.
- In the 'Task Views' group, click 'Gantt Chart'.
- You are now in Gantt Chart view.
Gantt charts transform your project timeline from abstract dates into a visual roadmap where you can instantly spot task dependencies, resource conflicts, and scheduling bottlenecks. While the bars and timelines seem straightforward, the real power lies in pattern recognition—you'll quickly identify which delays will cascade through your entire project and which tasks have flexibility.
This visual perspective reveals the critical path that determines your project's success, helping you make informed decisions about where to focus your attention and resources when problems inevitably arise.