Here’s how to do it:
- Start by opening your Microsoft Project file.
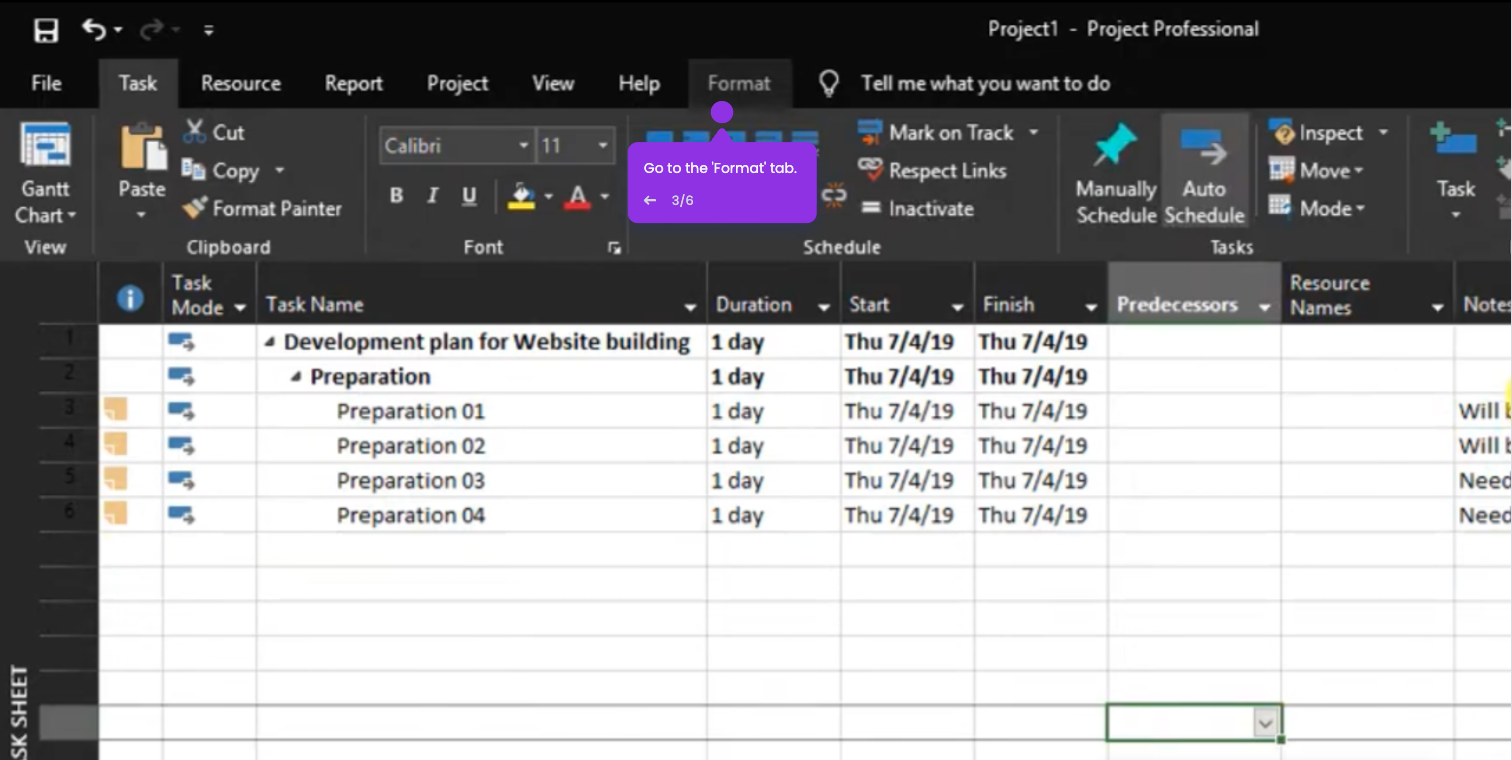
- Navigate to the "View" tab in the ribbon at the top of your screen.
- Look for the "Task Views" group and click on "Gantt Chart".
- You're now looking at the Gantt Chart view where you can see your tasks as bars on a timeline.