This interactive demo was created free with Storylane in 2 minutes. Create your own demo
Start free
All Tutorials /MS Project

How to See the Critical Path in Microsoft Project

Updated on:
May 13, 2026
By:
Madhav Bhandari
Use this interactive demo to learn how to visualize the critical path in Microsoft Project.

Quick summary

The critical path in Microsoft Project highlights the sequence of tasks that directly control your project completion date. Enabling the Critical Tasks view lets project managers instantly spot scheduling bottlenecks and prioritize work that cannot slip.


Steps

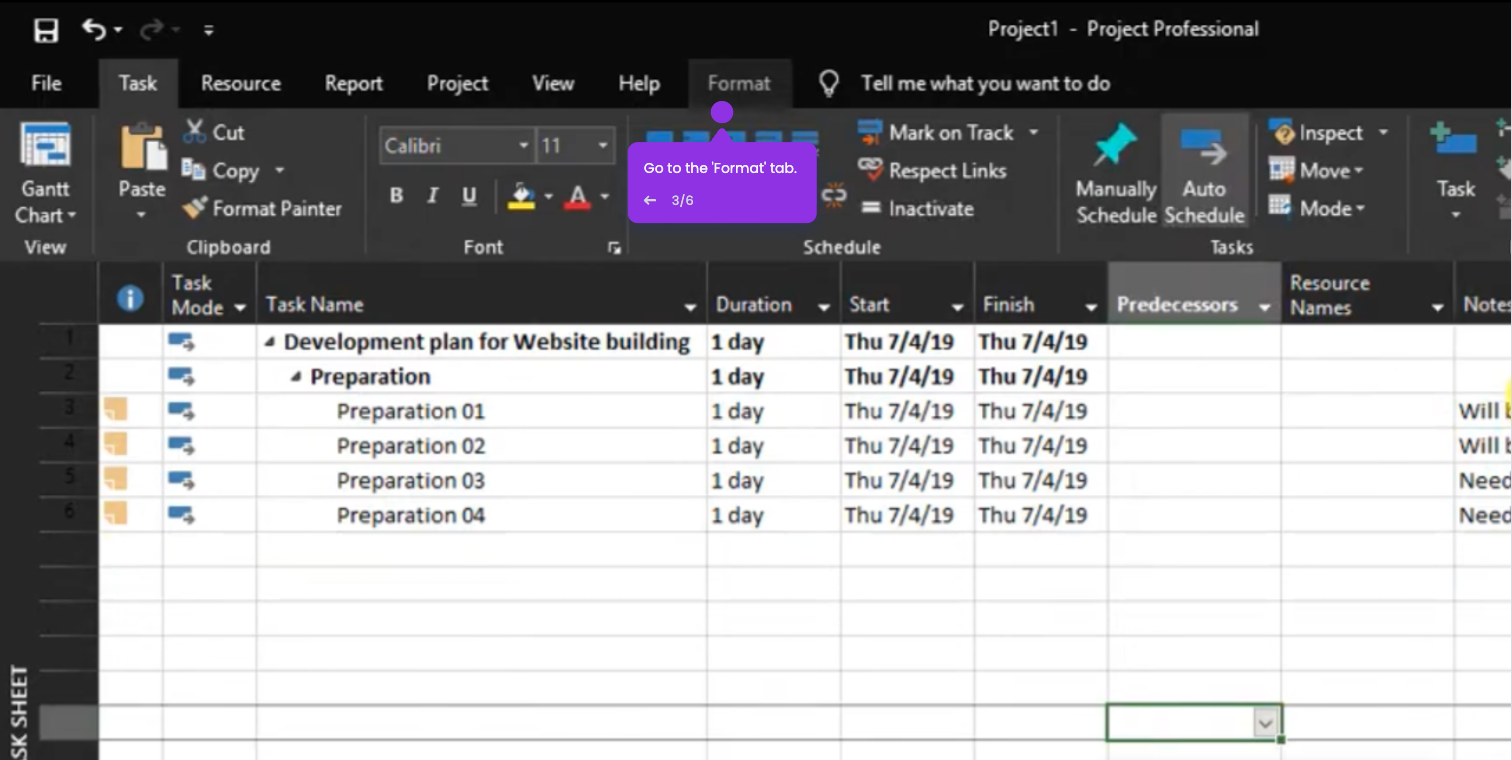
  1. Open your Microsoft Project file and navigate to the Gantt Chart Format tab in the ribbon menu.
  2. Click on the Format tab in the ribbon, locate the Bar Styles section, and check the box labeled Critical Tasks to highlight your project's critical path.
  3. Review the updated Gantt chart where critical tasks now appear in red and non-critical tasks remain blue, allowing you to quickly identify which tasks directly impact your project completion date.

📌 Why this matters

Identifying the critical path is essential for effective project management because it reveals exactly which tasks control your project's deadline. In Microsoft Project, the Critical Tasks feature gives project managers a clear visual map of schedule-driving activities, making it easier to allocate resources, mitigate delays, and keep projects on track. Without this visibility, teams risk spending time on low-priority work while deadline-critical tasks fall behind. This demo matters because it turns a powerful but often overlooked Microsoft Project feature into a fast, repeatable workflow anyone on the team can follow.
Your product deserves an interactive demo
Start free
Similar Articles
MS Project

How to Wrap Text in Microsoft Project

Madhav Bhandari
Director of Marketing @ Storylane
MS Project

How to View Gantt Chart in Microsoft Project

Madhav Bhandari
Director of Marketing @ Storylane
MS Project

How to View Full Gantt Chart in Microsoft Project

Madhav Bhandari
Director of Marketing @ Storylane
No items found.
Platform
Interactive Demos
Sandbox Demos
Buyer Hub
RepX
Integrations
Solutions
Product Marketers
Growth & Demand Gen
Sales Reps & AEs
Presales & SEs
Customer Success
Product Managers
Customers
Demo Showcase
Customer Stories
Finer Demos Club
Features
Demo Signals
Personalization
Deal Intelligence
Resources
Blog
The Plot
Tutorials
Events & webinars
Help Docs
What’s New
Demo Dundies
Company
Careers
Pricing
Partners
Contact
Trust Center
Backed by
Chrome Extension Icon
Chrome extension
Download
Desktop app
Download
Built in San Francisco Bay Area - ©2026 Storylane
Privacy PolicyTerms & Conditions
X Corp (formerly Twitter)LinkedIn
This website uses cookies to ensure you get the best experience on our website. Learn More
Got it
This website uses cookies to ensure you get the best experience on our website. Learn More
Got it