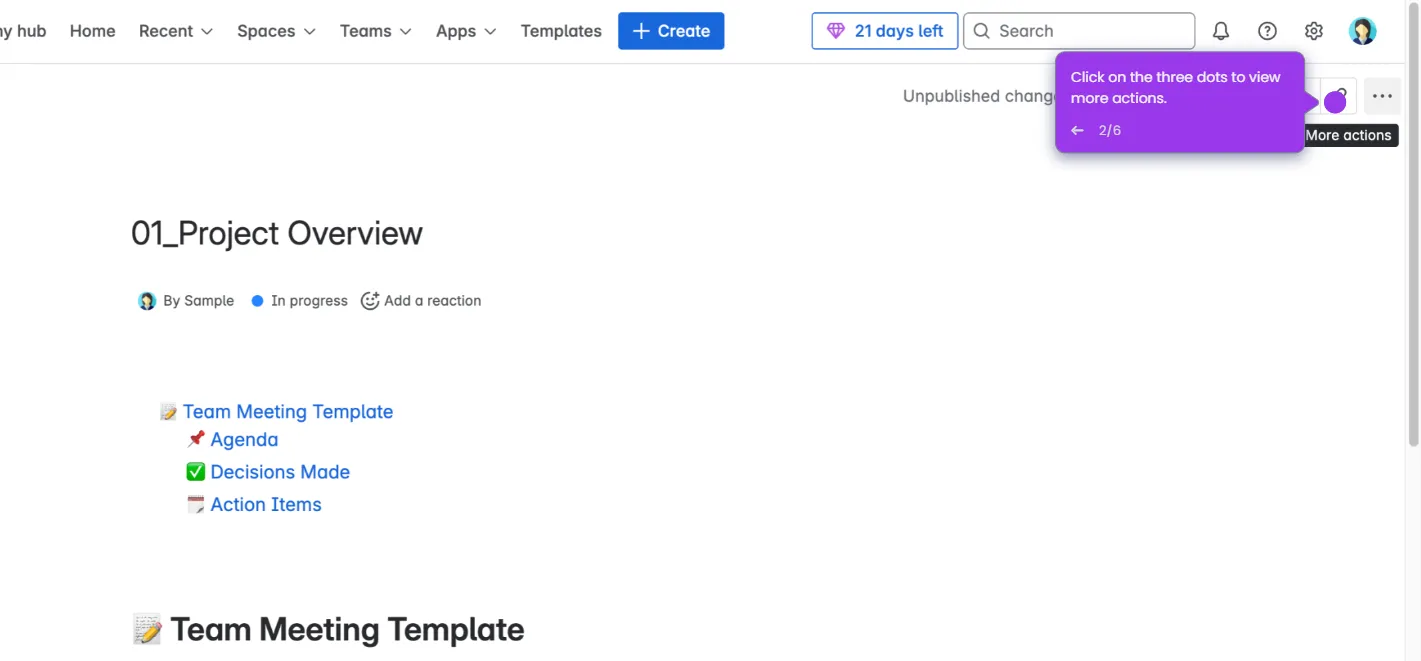
Quick summary
This demo shows how to create a visual project timeline in Confluence using a structured table with status indicators to track task delays and progress at a glance. Teams can use this approach to surface blockers, compare planned versus actual dates, and keep stakeholders aligned inside their existing Confluence workspace.
Steps
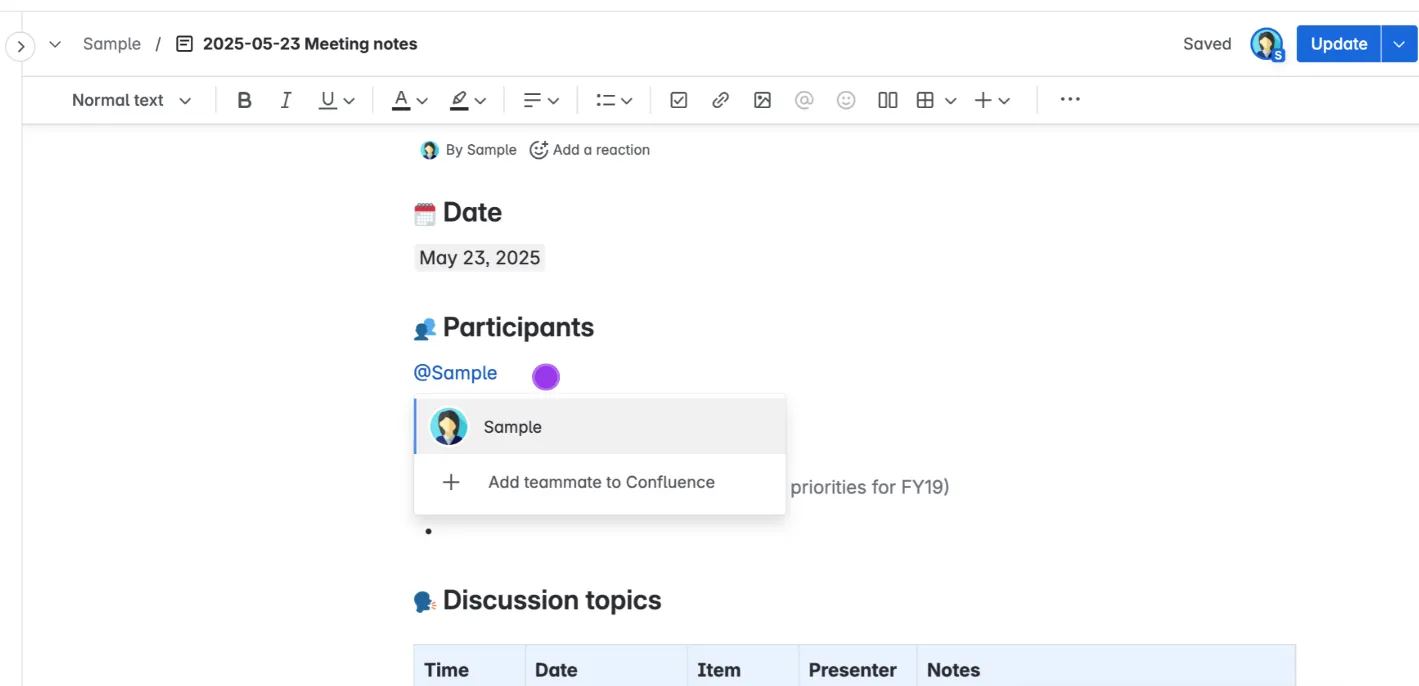
- Create a new page or open an existing one in your Confluence space.
- Type
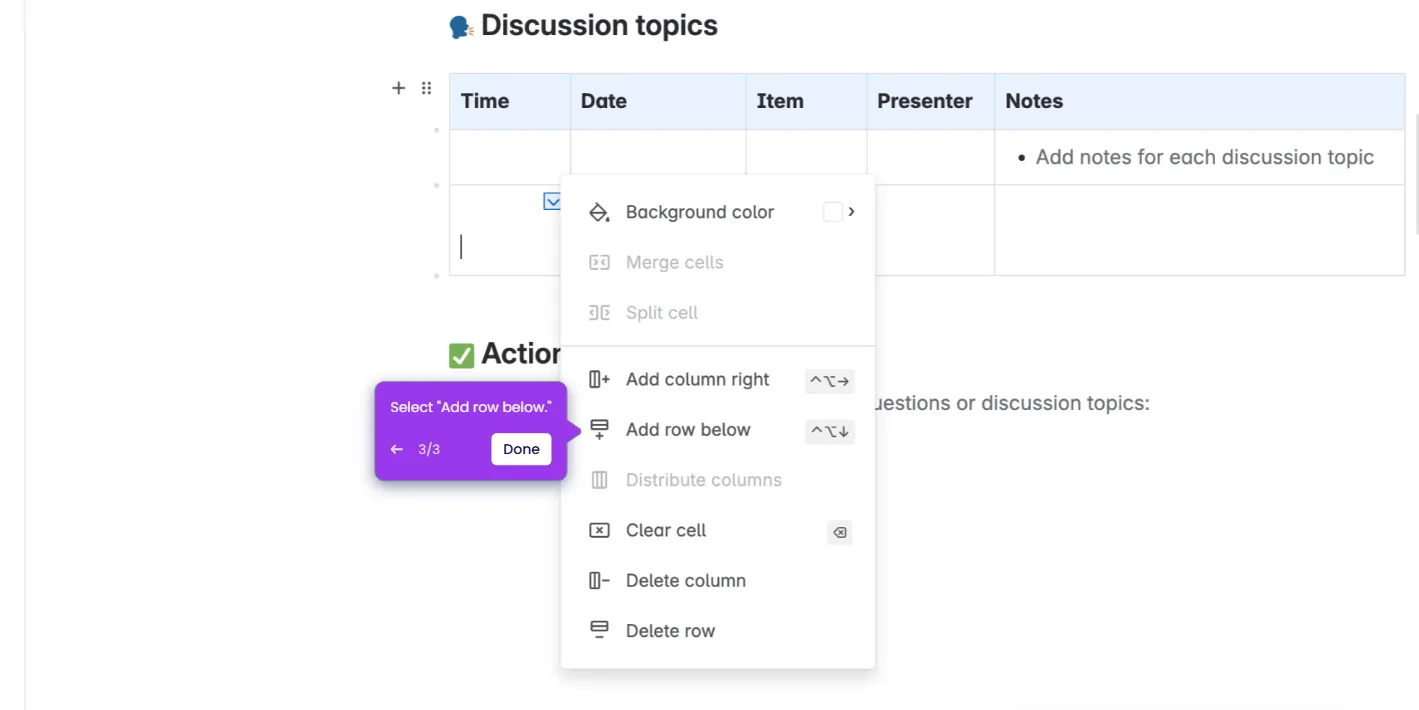
/tablein the editor to insert a blank table on the page. - Add columns including Task, Planned Date, Actual Date, Delay, Status, and Notes to structure your timeline.
- Fill in rows with task details and use emojis (✅ ⚠️ ❌) or /status macros to visually indicate progress for each item.
- Once all rows are complete, click "Publish" or "Update" to save and share the page with your team.