.gif)
.svg)


Quick summary
In Coda, creating views lets you display the same table data in multiple formats without duplicating it. You can filter, format, and configure each view independently to match different workflows or audiences.
Steps
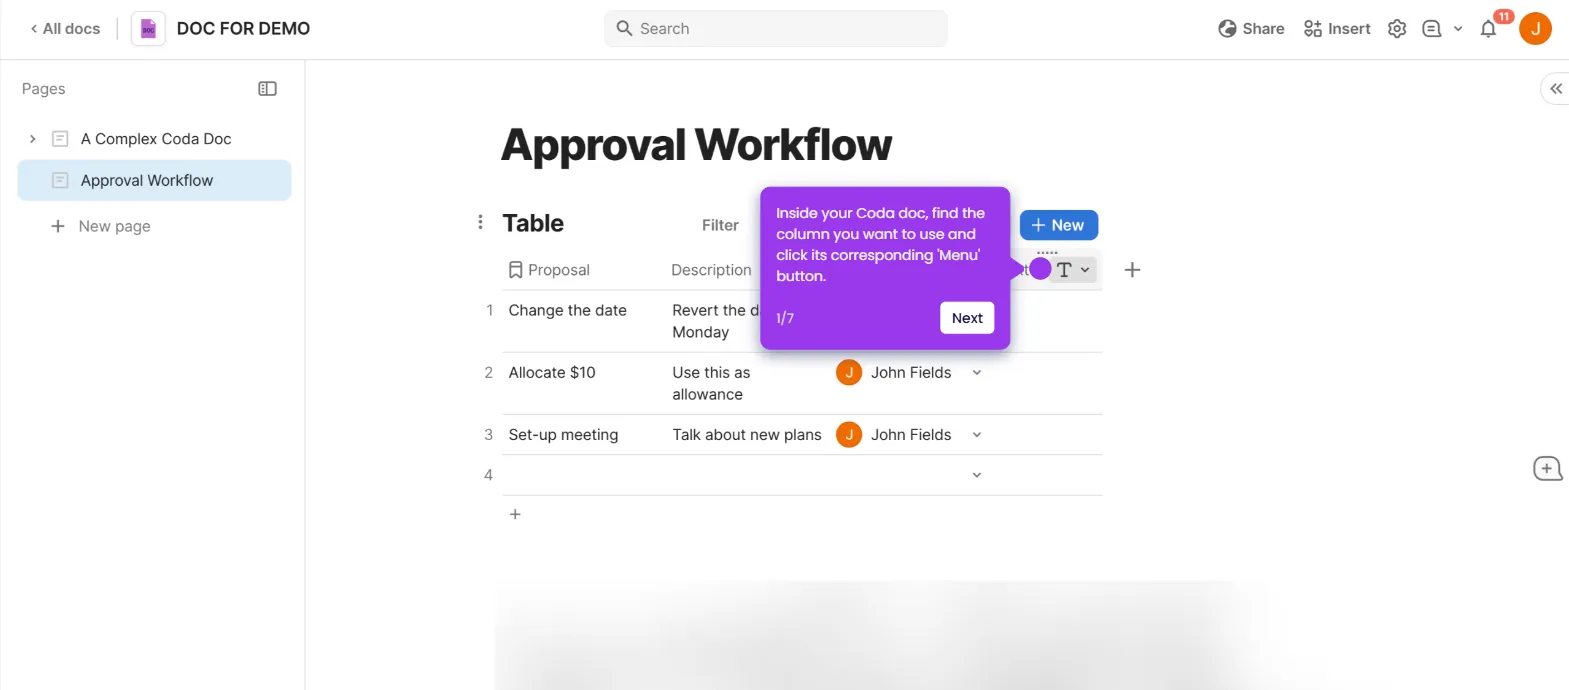
- Click on the add icon to begin inserting a new element into your Coda document.
- Select the Table option to organize your data in a structured, easy-to-manipulate format.
- Connect to an existing table to leverage data you have already created in your document.
- Provide a name for your new view to display your data from a different perspective.
- Review the default Table view, which shows all your data comprehensively.
- Apply filters to display only specific data rows, such as filtering by the Habit column.
- Click the ellipsis icon to open your view's settings and personalize it for your specific context.
- Configure display settings for the view to make data easier to analyze and read.
- Open Conditional format to add rules that style text and colors based on your data.
- Click Add rule to create a new formatting rule that automatically styles cells based on criteria you define.
- Select the Habit column to apply your conditional formatting rules to the correct data field.
- Fine-tune display settings for each view to achieve a cleaner, more focused look.
- Your table views are ready — the same data now appears in different formats without any duplication.