This interactive demo was created free with Storylane in 2 minutes. Create your own demo
Start free
All Tutorials /Coda

How to Create Burndown Charts in Coda From Trello Data

Updated on:
May 12, 2026
By:
Madhav Bhandari
Use this interactive demo to learn how to turn Trello card data into a burndown chart inside Coda.

Quick summary

This tutorial shows how to connect Trello to Coda using the Trello Deluxe Pack and sync card data to generate a burndown chart with a line chart display. Teams using both Trello and Coda can visualize sprint progress directly inside their Coda doc without any manual data entry.


Steps

  1. Inside your Coda doc, head to the top-right corner and click Insert.
  2. Tap the Packs tab to proceed.
  3. Find and select Trello Deluxe from the Packs list.
  4. Select Cards from the options, then drag it to the main workspace for customization.
  5. Tap Connect an Account to begin linking your Trello account.
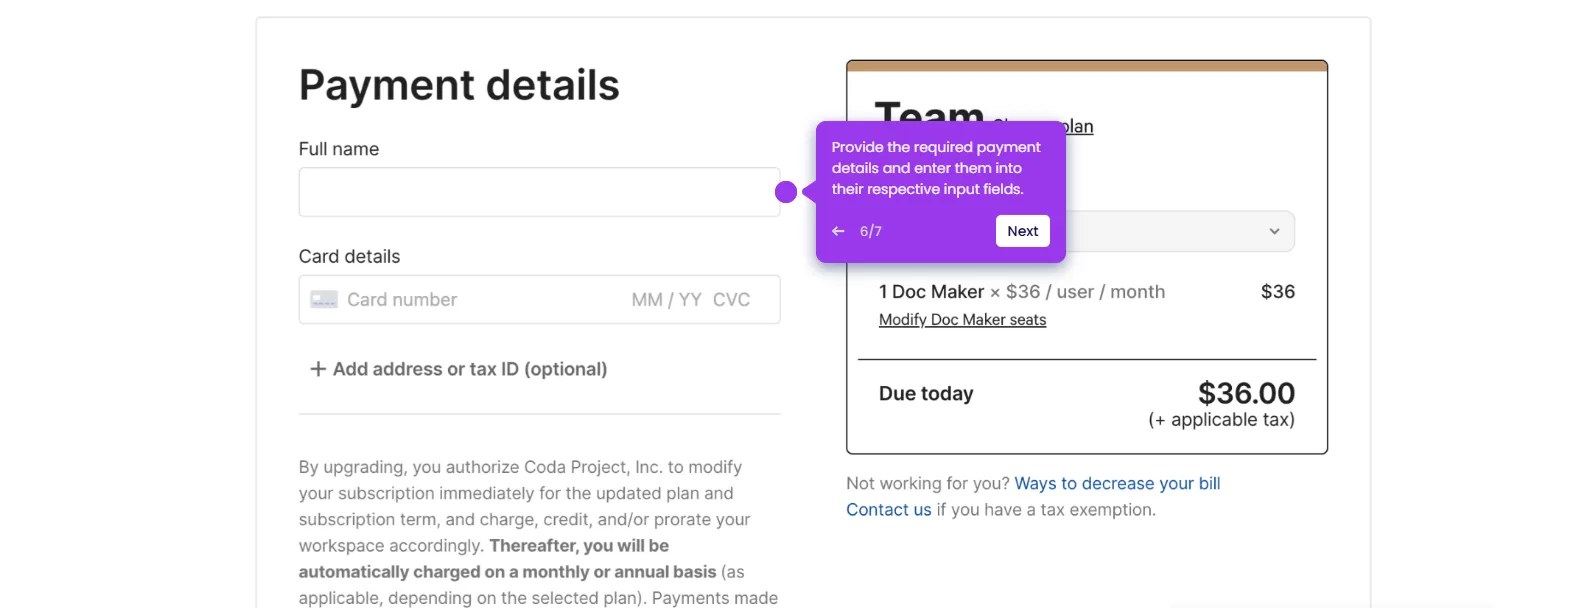
  6. Enter your Trello API credentials into their respective input fields.
  7. Click Continue to proceed.
  8. Tap Complete Setup to enable the connection and start creating the chart.
  9. Click Choose What to Sync to configure your data source.
  10. Open the Workspace menu in the right panel and select the Trello workspace containing the cards you want to use.
  11. Tap Sync Now to import your Trello card data into Coda.
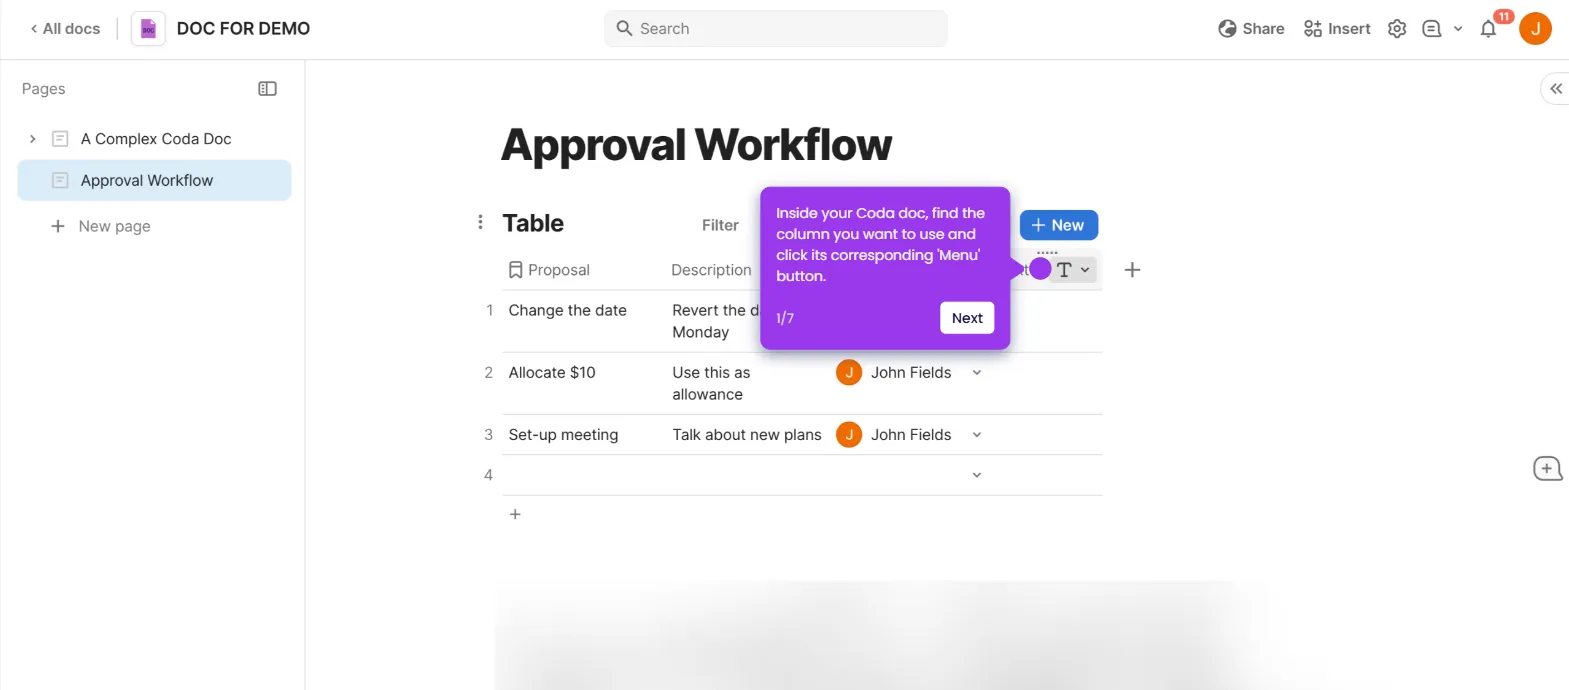
  12. Click the drop-down arrow next to the Refresh button to access chart conversion options.
  13. Tap Settings to open the table settings panel.
  14. Click More to view additional format options.
  15. Choose Chart from the list of available options.
  16. Click Chart Display to begin customizing the chart appearance.
  17. Set the Chart Type to Line Chart.
  18. Select Count as the Card Values metric.
  19. Configure any remaining settings to customize the content and appearance of your burndown chart.
  20. Your Coda burndown chart is now created based on the selected Trello data.

📌 Why this matters

Building a burndown chart from Trello data inside Coda eliminates the need to manually export or reformat project data across tools. By using the Trello Deluxe Pack in Coda, agile teams can sync card counts directly into a live line chart that reflects sprint progress in real time. This integration gives project managers a single source of truth for tracking remaining work, making it easier to spot blockers and forecast delivery dates. For teams already using Trello for task management and Coda for documentation, this workflow removes friction and surfaces actionable sprint metrics without leaving either platform.
Your product deserves an interactive demo
Start free
Similar Articles
Coda

How to Set Up Team Billing in Coda

Madhav Bhandari
Director of Marketing @ Storylane
Coda

How to Use Coda’s REST API

Madhav Bhandari
Director of Marketing @ Storylane
Coda

How to Create Approval Workflows in Coda

Madhav Bhandari
Director of Marketing @ Storylane
No items found.
Platform
Interactive Demos
Sandbox Demos
Buyer Hub
RepX
Integrations
Solutions
Product Marketers
Growth & Demand Gen
Sales Reps & AEs
Presales & SEs
Customer Success
Product Managers
Customers
Demo Showcase
Customer Stories
Finer Demos Club
Features
Demo Signals
Personalization
Deal Intelligence
Resources
Blog
The Plot
Tutorials
Events & webinars
Help Docs
What’s New
Demo Dundies
Company
Careers
Pricing
Partners
Contact
Trust Center
Backed by
Chrome Extension Icon
Chrome extension
Download
Desktop app
Download
Built in San Francisco Bay Area - ©2026 Storylane
Privacy PolicyTerms & Conditions
X Corp (formerly Twitter)LinkedIn
This website uses cookies to ensure you get the best experience on our website. Learn More
Got it
This website uses cookies to ensure you get the best experience on our website. Learn More
Got it