Quick summary
Microsoft Planner does not have a native Gantt chart view, but you can replicate one using the built-in Bucket chart after organizing your tasks with timelines, assignments, and progress-based buckets. This step-by-step walkthrough shows exactly how to set up and view a Gantt-style chart in Microsoft Planner using existing plan data.
Steps
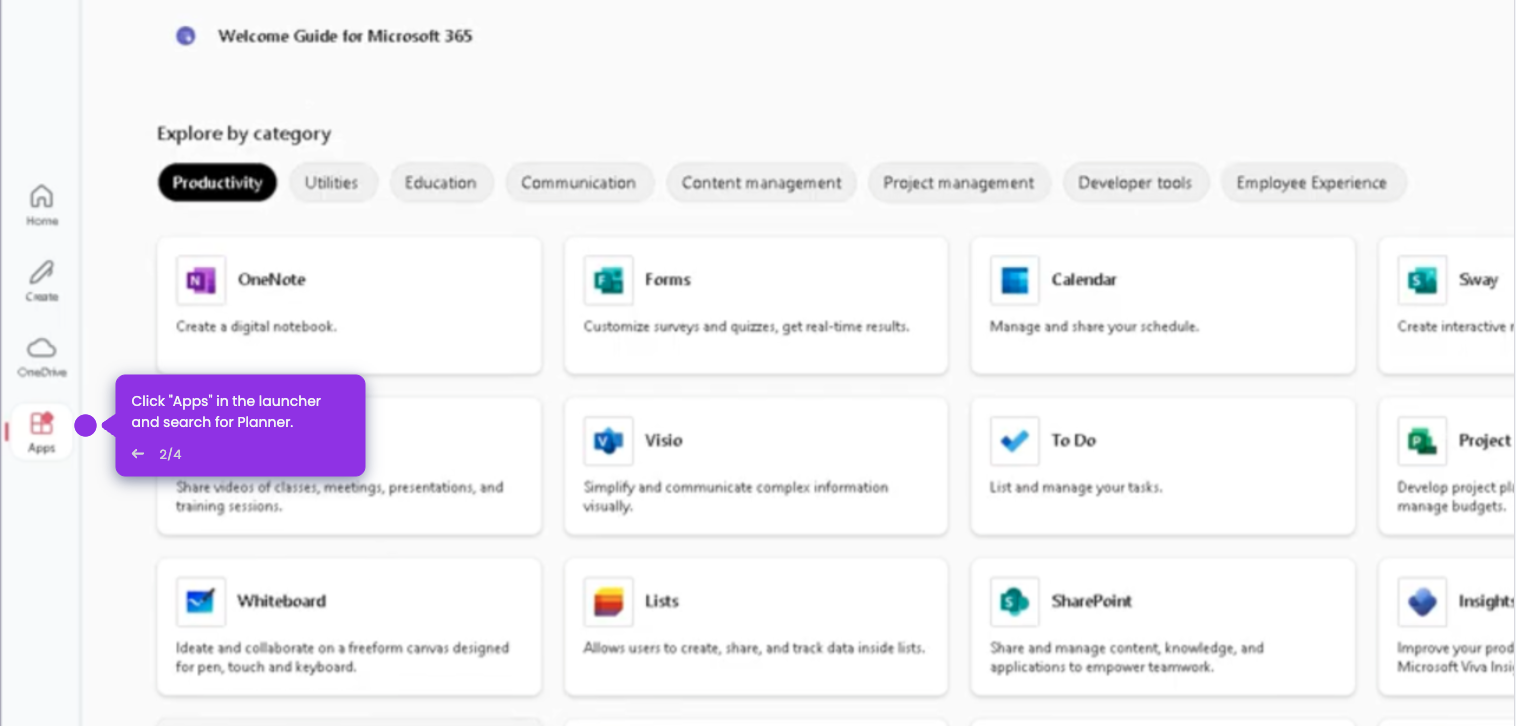
- Go to the left-side panel and click My Plans.
- Find and select the plan you want to use for your Gantt chart.
- Click the task cards one by one to open each task.
- Make sure each task has the correct timeline, assignments, and task details filled in to support the Gantt chart layout.
- Group the task cards by dragging them into their respective buckets based on progress status.
- Click the View Charts option from the top navigation.
- Select the Bucket chart — this is the closest available view to a traditional Gantt chart in Microsoft Planner.