


.webp)
Your sales funnel is a map that helps you guide your prospects' buyer journey in a competitive market.
And if your map is unreliable, you're never going to get anywhere.

To avoid losing leads in a disorganized funnel, you need to be intentional with how you build your funnel.
So, how can you position yourself for success when building a SaaS sales funnel?
We've got you covered - this article will give you a detailed overview of the steps involved in planning, creating, and preparing a winning sales funnel strategy well before engaging potential customers.
What is a Sales Funnel in the B2B SaaS industry?
Picture the sales funnel as a typical funnel. In the industry, we divide the funnel into 3 stages. The funnel represents the stages through which leads are acquired and converted into paying customers. Your job is to ensure that this funnel attracts leads and flows smoothly through the funnel and comes out of it as customers.
When it comes to SaaS, sales funnels are typically digital and automated. You can create different assets to attract leads, engage them, and eventually, convert them. And in order to keep track of their flow through the funnel, you can use CRMs.
Let’s take a deeper look into the 3 stages of the SaaS sales funnel.
What are the 3 Stages of the SaaS Sales Funnel
Every stage has a distinct target audience with variations in buying intent. Let's delve into the sales funnel stages and explore practical strategies to help you succeed at each stage:
[TOFU] Top of the funnel: The awareness stage
This is the stage where you have to draft your action plan to capture the audience in your total addressable market. In the awareness stage, prospects are either
- Unaware of the problem and the solution,
- Aware of the problem but unaware of the solution
- Aware of the solution but unaware of the products
- Aware of the solution and the products
Find out audiences in different segments and try to create content that caters to the segments where most of your audience are.
The goal in the awareness stage is to introduce common problems in the industry, educate potential buyers on the problem and its impact on a business, and establish that you have the solution they're seeking.
How do you and your marketing team achieve this? Here are some tried and tested strategies:

- Create educational and informative blog posts - Gong Labs is a great example with their actionable and data-backed insights into SaaS sales
- Produce engaging YouTube videos - the Salesforce YouTube channel has multiple different playlists spanning customer education, testimonials, actionable '101' explainer videos, and expert tips for SaaS professionals
- Provide lead magnets such as eBooks and reports - much like Hubspot and Sprout Social's vast free resource libraries and strong tools
Remember, it's not just about attracting their attention—it's about capturing their interest and establishing a connection. By doing so, you'll nurture their interest and gradually guide them to the next stage of the funnel.
[MOFU] Middle of the funnel: The consideration stage
This is the stage where prospects actively evaluate potential solutions before making a decision. These prospects are probably problem and solution-aware.
But here's the thing—you're not the only player in the market. They're likely evaluating other options, such as competing SaaS products, agencies, or even building a solution in-house.
That’s why the content in the middle of the funnel takes on a different flavor. Instead of convincing them why they need a solution like yours, your focus should be on persuading them that your product is the absolute best choice for their specific needs. Here's what kind of content you should be focusing on:
Case studies: Check out Databox’s catchy, results-driven titles. Heap’s problem-solution storytelling has every case study starting like this:

- Webinars: Look to Drift for their past and upcoming webinars full of valuable content for their audience. Brand presence also plays a role here in helping the audience choose
- Full presentations and impactful demos: By customizing your messaging and presenting a compelling demo tailored to each decision maker's specific needs, you can effectively guide your leads toward the final stage of the funnel
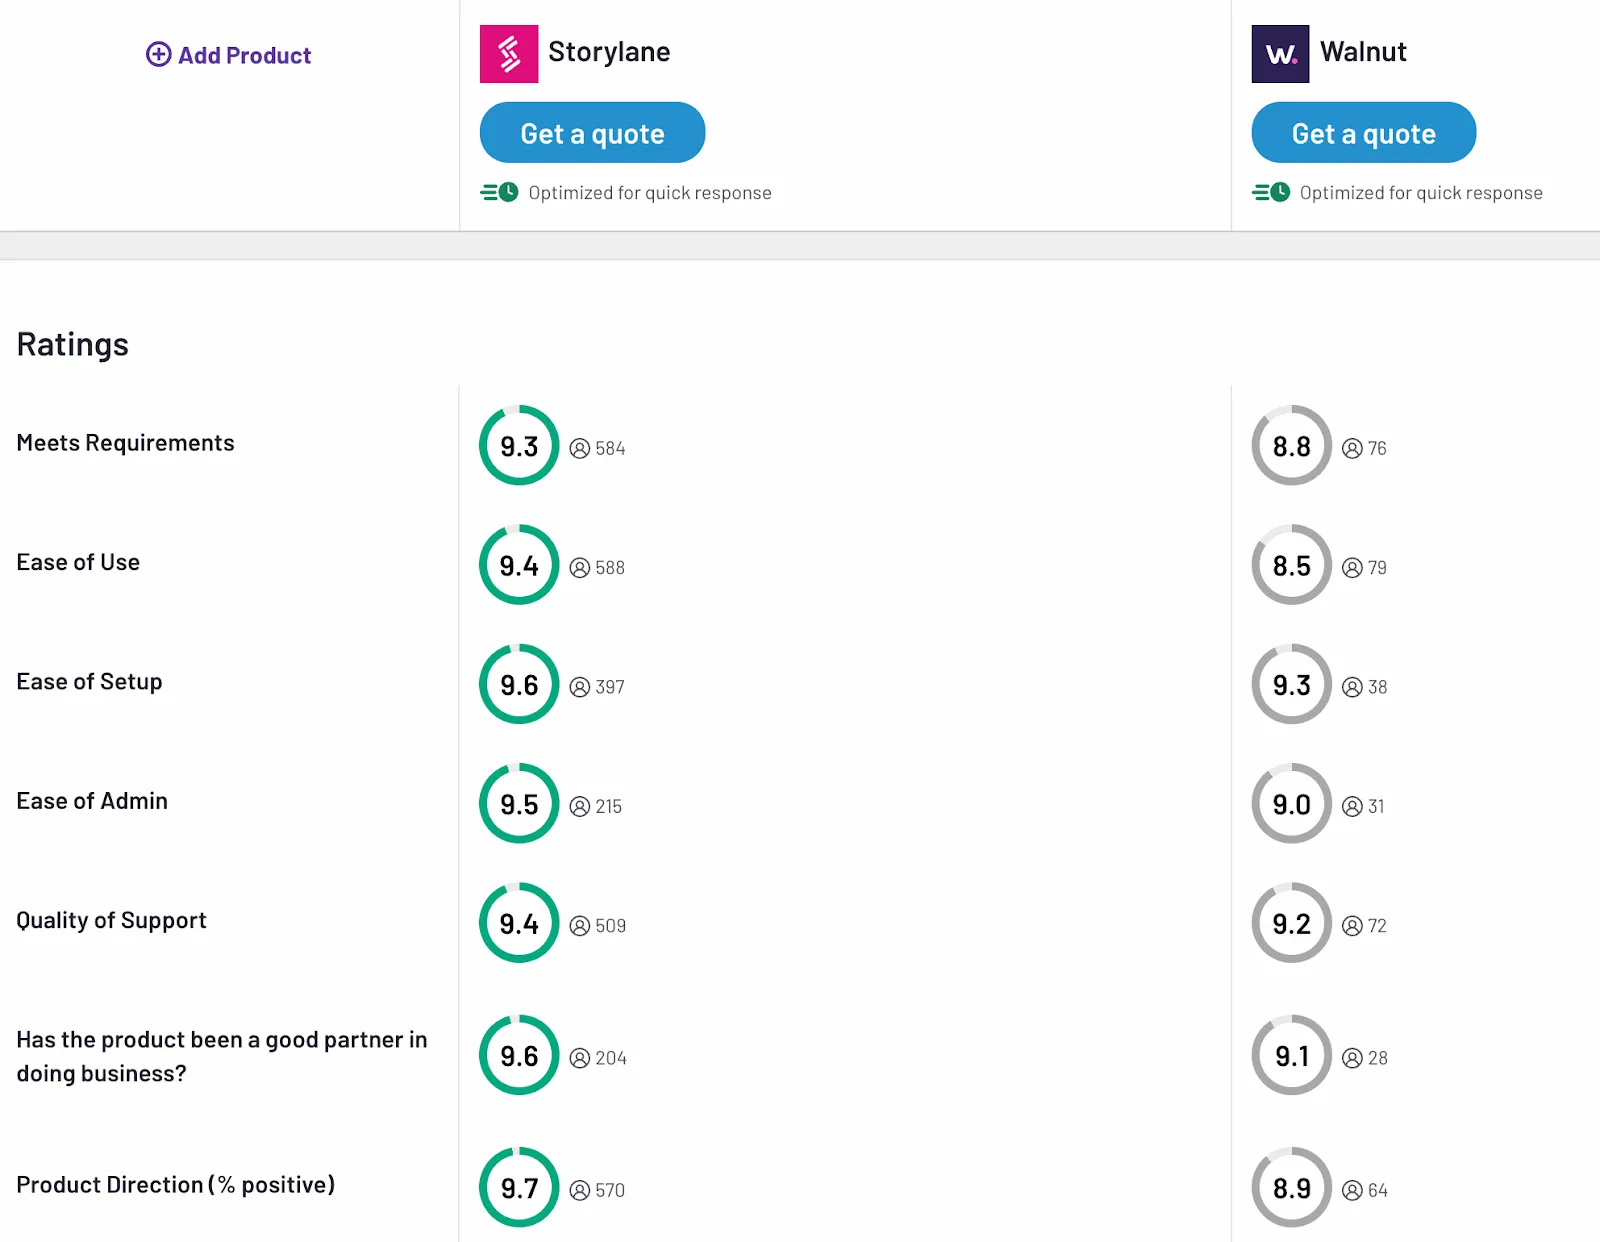
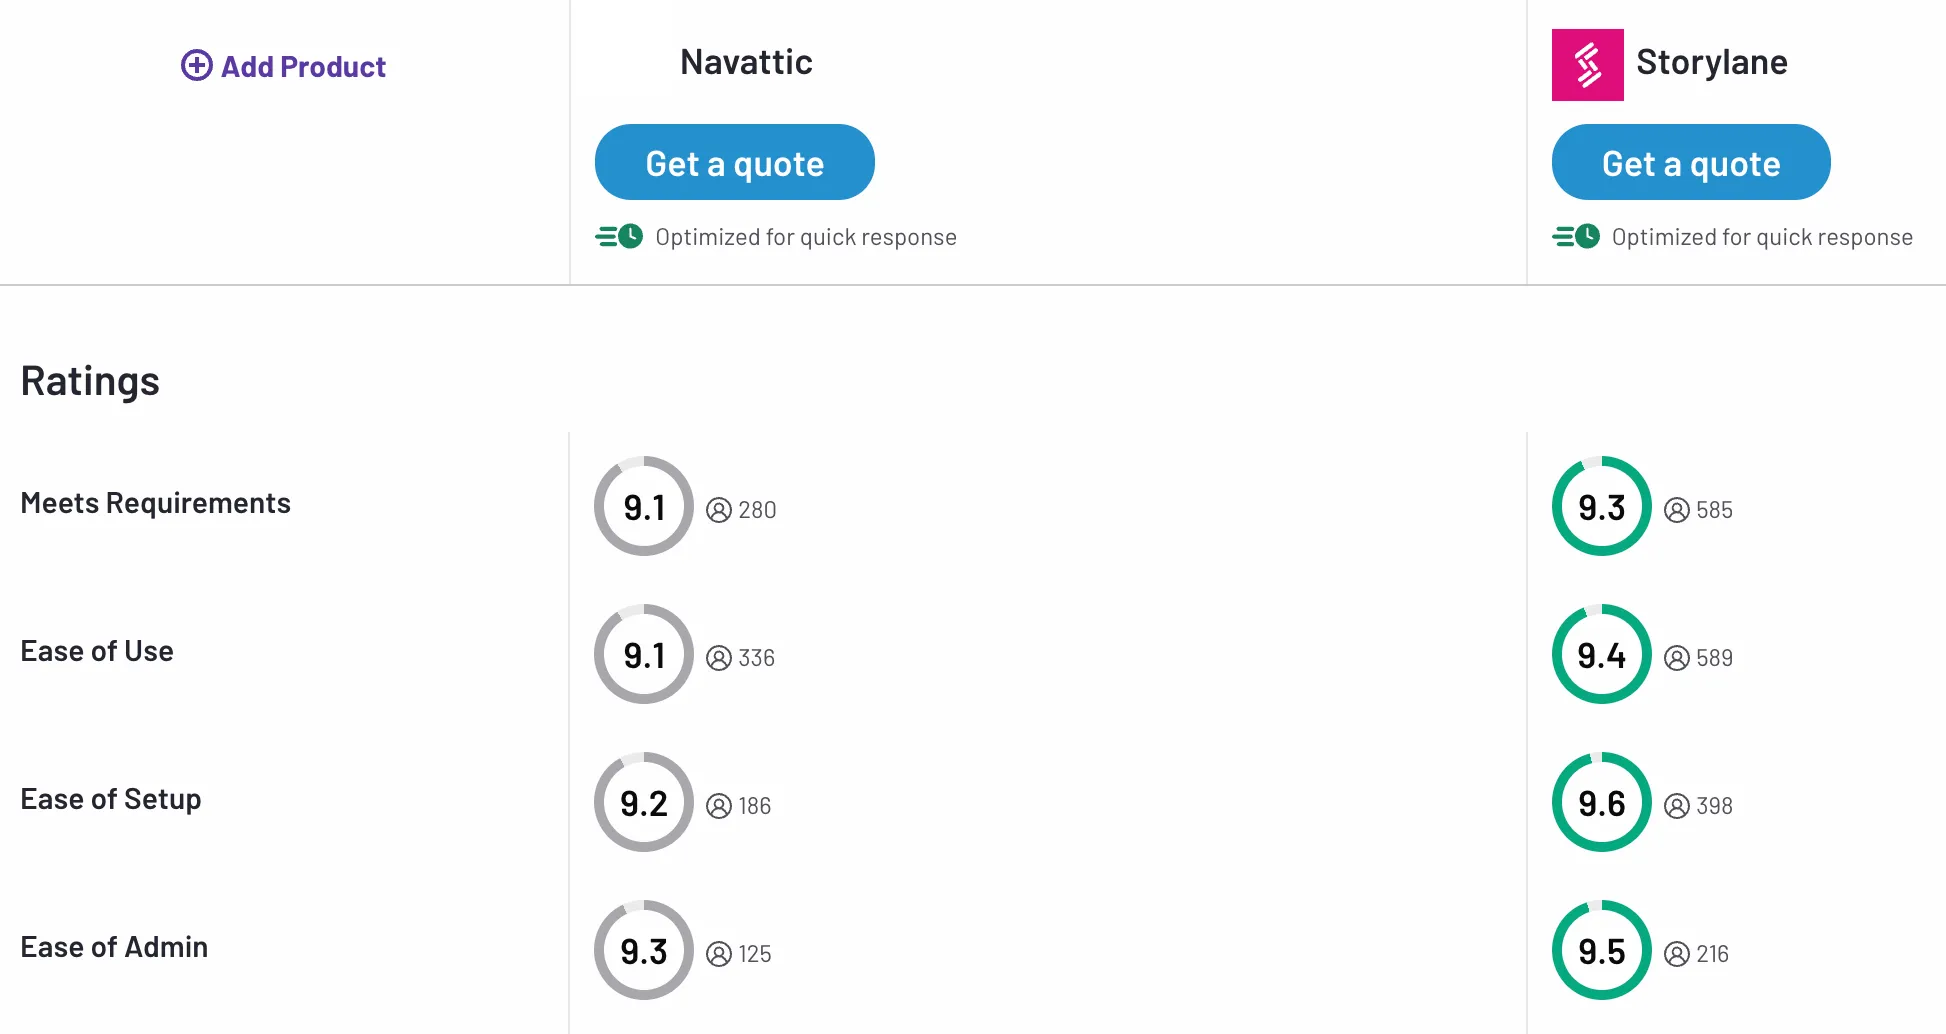
- Offer interactive product experiences on your website or on trustworthy review sites: Check out Clevertap - they've got interactive demos powered by Storylane on their G2 page to better educate interested buyers who have actively sought out reviews for their software
At the middle of the funnel, your sales team plays a crucial role in connecting the dots for prospective customers between creating awareness and making informed decisions.
Sales representatives should ideally engage with the leads, ask pertinent questions, and assess whether your offer aligns with their problem. If buying intent is evident, the lead should be marked as a sales-qualified lead and guided toward a demo.
After this, you're at the last stage of the funnel.
[BOFU] Bottom of the funnel: The decision stage
At the bottom of the funnel, you create content or release marketing collateral to push leads to convert. At this stage, the prospects are already problem and solution aware, but they are struggling to get hold of the brand since there are probably one too many options. Here, you address objections, highlight the quality of your offering, discuss pricing, showcase other successful customers to present different use cases, and give them personal product demos to champion internally.
Content for the bottom of the funnel includes:
- Having a clear and informative pricing page with comparison tables that outline the different options available to them
- Offering personalized product demos that cater to each stakeholder’s specific needs
- Customer testimonials to build trust and provide social proof of your product's effectiveness
- The onboarding process for those who choose a free product or trial – this is your opportunity to deliver an amazing experience that showcases the value of your offering and encourages upsells to paid versions
- Comparison articles that differentiate your product from that of the closest competitors.
Example:
- Utilize paid ads on social media platforms that drive traffic to sign up forms - like Shopify's Facebook Ad Campaign.
- Alternative pages that Storylane has: Storylane vs Walnut.
Essentially, at this stage you need to make it easy for your prospects to complete the purchase. And don't forget to include a strong call to action (CTA) that encourages them to take that final step and become a valued customer!
So, how do you build this funnel from scratch? Let's walk through the steps together.
Also, check out: Tips to improve enterprise sales strategy
How to Build a SaaS Sales Funnel? - A Step-by-Step Guide

The process of building a SaaS sales funnel involves strategically mapping out the customer journey from initial contact to final conversion, ensuring a smooth and effective path toward sales success. Here's a step-by-step approach to constructing a SaaS sales funnel:
Step 1: Define your audience and gather insights on customer behavior
Think of this as the sales rep's version of a marketing persona. By analyzing your most profitable customers and identifying common characteristics such as demographics, occupations, and pain points, you can create customer personas that provide a clear picture of your target audience.
To gain a deeper understanding of your target audience's needs and pain points, you need insights into customer behavior as well. Find out from your sales reps, what their response to market is, what the customers are saying about your product and about the problem they’re solving.
By analyzing your sales data and leveraging user behavior details, you can refine your buyer personas and tailor your marketing strategies to target similar prospects. For example, your customers think that their use cases haven’t been recorded, in that case, make more case studies. Or customers let you know a benefit you were not aware of before, you can add that to your website home page, if there are enough customers with the same benefit. Or if your salespeople are complaining that leads are dropping off because of a lack of a feature, your product team can work on introducing it.
Armed with valuable information that can guide your decision-making process on how to attract and nurture leads, you can move on to the next step of building an effective funnel.
Also, check out: Top Pre sales softwares
Step 2: Decide how to attract leads
To attract your target audience, create compelling content that adds value and captures their attention of the prospects at every stage of the sales funnel. This could be in the form of a low-commitment lead magnet, such as:
- A case study,
- An e-book,
- A webinar,
- Free templates,
- Freemium plans or free trials,
...or anything else that addresses their pain points and provides a solution valuable enough for them to fill out a lead capture form.
When a buyer shows interest in your offering, it's crucial to guide them to a robust landing page that provides all the necessary information to move them through the sales funnel. This page should describe your product, showcase your company's uniqueness, and include a compelling call-to-action (CTA) that directs the consumer on what to do next.
Your landing page is also an excellent place for an interactive product demo that either starts or ends with a lead capture form. With the help of Storylane's interactive demos, you can truly showcase your product in action, giving target customers a firsthand experience that highlights its unique benefits.
Check out Ignition's landing page - it incorporates a lot of these must-haves to attract leads, offering demo access with a lead capture form:

➕Pro Tip: Tailor your lead generation strategies for high quality traffic
The heart of any campaign is to drive high-quality traffic to your landing page/webpage.
But what defines high-quality traffic?
- Interested in your lead magnet or the service that you are offering.
- Afford to buy your product after nurturing.
To start with:
- Analyze the behavior of your target audience.
- Find the place they spend their time.
- Once you have sorted your audience list, run your campaigns to grab their attention on those platforms.
Once you've got a significant amount of leads in your pipeline, it's time to nurture them strategically - and with that, you can move on to the next step.
Step 3: Nurture leads
Once potential customers have shown interest in your product or service, it's time to nurture that interest further. Nurturing campaigns play a vital role in educating customers about your product, building trust and loyalty, and eventually, converting the lead. This is where both marketing and sales can run personalized nurture campaigns to prospects. High intent leads or those who are an exact match with the ICP can be added to the sales reps’ pipeline. And low intent leads or those who signed up for e-books or templates can be added to an automated email sequence to nurture the intent.
Here are some effective strategies for nurturing leads:
- High-Quality Content: Create content that educates and captivates potential customers. This can take the form of webinars, videos, or blog posts that provide insights into your industry. By offering valuable information, you establish trust and position yourself as a thought leader.
- Email Sequences: Prospecting emails can be an effective strategy, especially when they include new offers or discounts. This approach not only helps build a strong sales pipeline but also improves sales velocity by always staying on top of the mind of the audience.
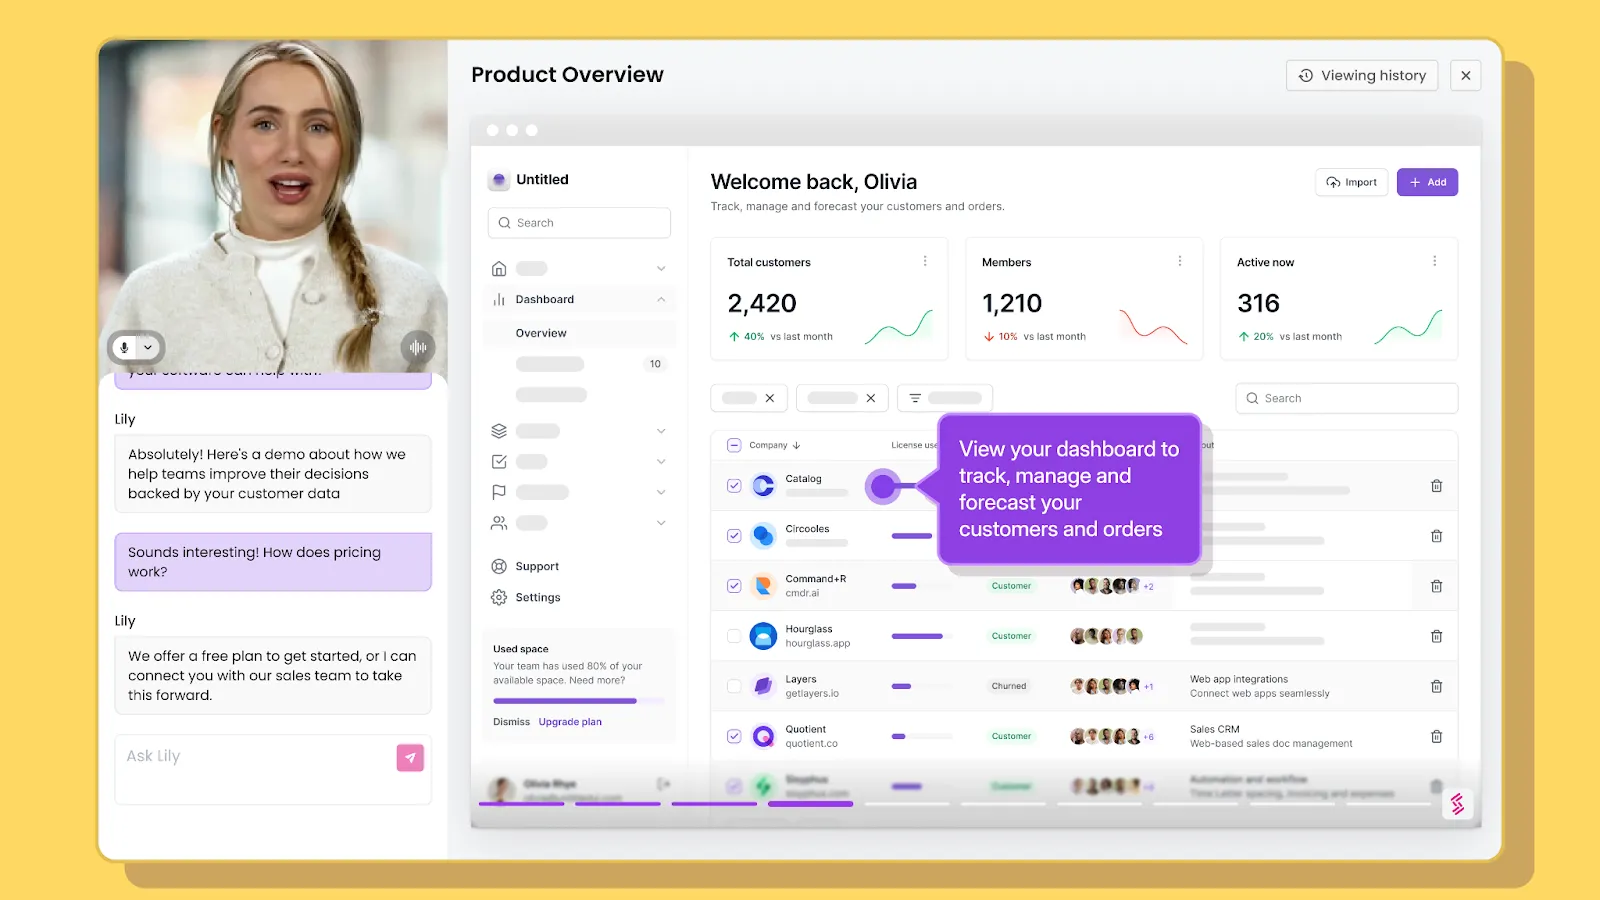
- Personalized Demos: Incorporating demo software like Storylane can significantly streamline your sales reps' workflow. It automates the process of personalizing demos for prospects by pulling their basic information from your CRM system and tailoring the interactive demonstration specifically for them. It saves time and ensures a more personalized and engaging experience for potential customers.
- Retarget prospective buyers: For both high-intent and low-intent prospects, target ads through social media posts or other websites to keep your brand fresh in their minds. In the case of an abandoned pricing page, you can retarget them with ads that offer a free trial or highlight the exceptional benefits of your product.
Remember, nurturing prospects is a process that requires time, patience, and consistency. Not every prospect will convert immediately, but by implementing these lead nurturing strategies, you increase the likelihood of eventual conversions.
Step 4: Plan to convert leads
If you've successfully nurtured your leads, your ideal customer should be well acquainted with your SaaS product. Now, it's time to turn those prospects into paying customers.

Here's a few things you can include in your BOFU plan:
- Pricing plans tailored to meet customer needs: Customers have varying interests and budgets, and it's crucial to provide them with pricing options that cater to their specific requirements. By offering different plans, you can appeal to a broader audience and expand your customer base.
- Sales enablement collateral: This is the content you create to give the buying process a final push with a display of expertise - like playbooks, FAQs, sales onboarding kits, detailed how-to guides, white papers, case studies, and more.
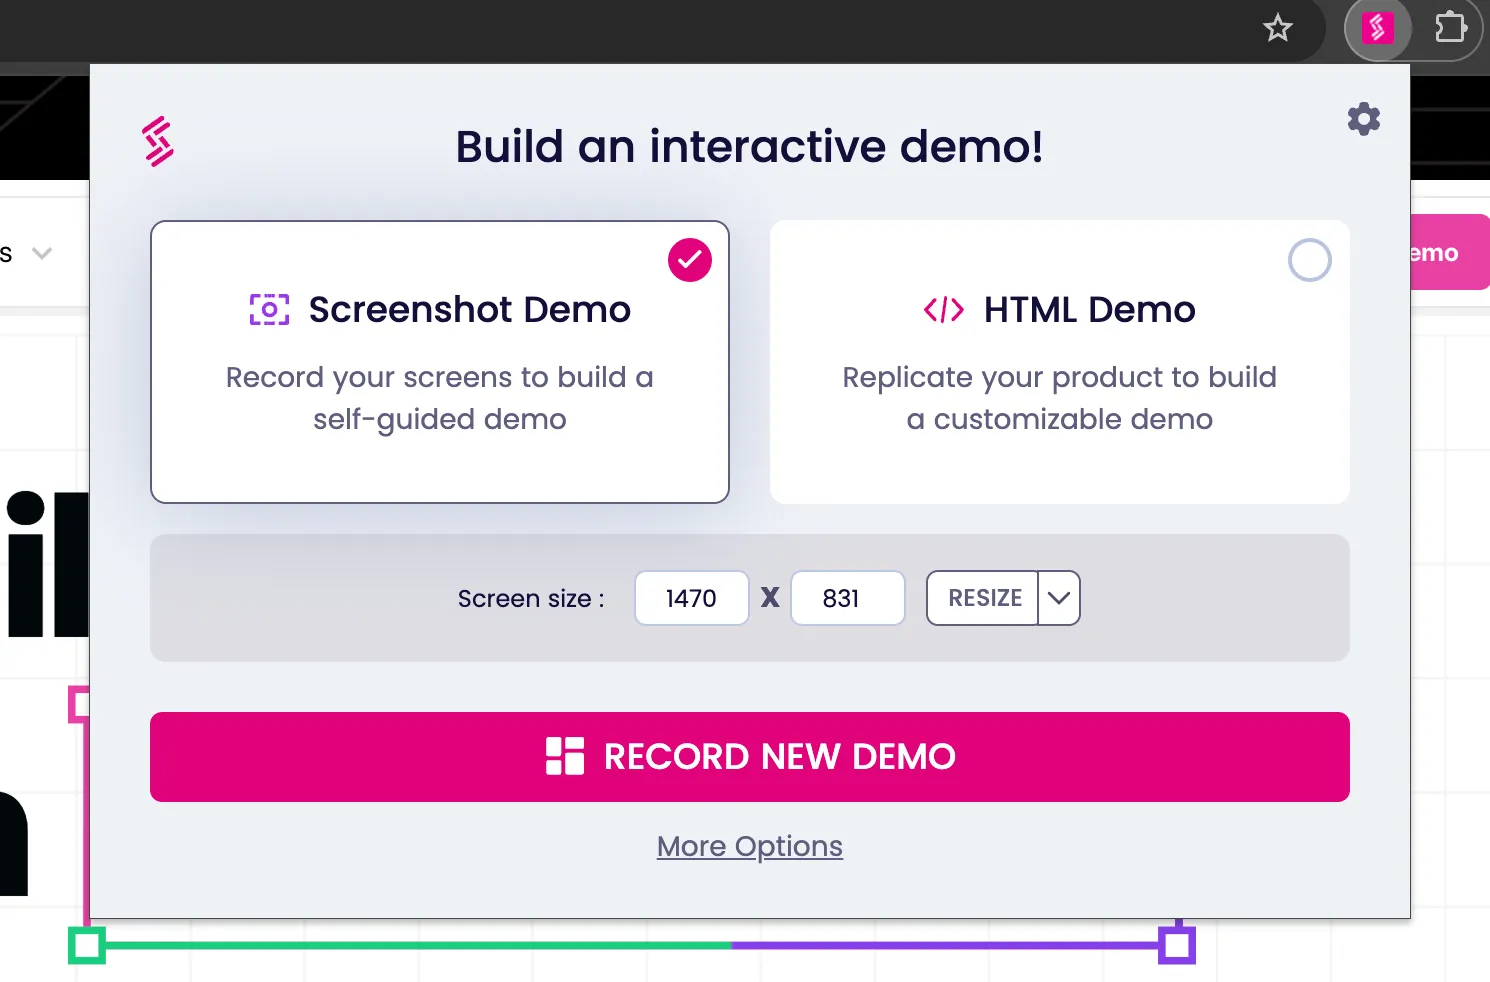
- Sales demo presentations: In SaaS, personalized and interactive product demos have become essential. If you're looking to create a compelling product demo without any coding, Storylane helps you build a customized demo in under ten minutes.
- Negotiation: At this point in the funnel, potential clients may have specific requirements and ask for adjustments - you'll have to be ready to negotiate. Remember that negotiations involve finding a mutually beneficial solution. Stay adaptable and innovative during this stage to encourage them to make that final commitment.
Step 5: Have a good customer success plan
Once a sale is made, it's crucial not to overlook the importance of customer success. Here are some good-to-do actions to maintain customer satisfaction:
- Start off with a welcome email offering essential product information to new clients – this ensures they can maximize the benefits of your product
- Personalized customer onboarding with a seamless guided product tour
- Offer personalized support options like one-on-one calls or chat support for any problems encountered while using the product
- Actively seek honest customer feedback and reviews – this makes customers feel heard and allows you to identify areas for improvement
Customer loyalty is a valuable asset to any company. It ensures continuous revenue and fosters positive online buzz and word-of-mouth promotion.
But your work doesn't end here - how do you make sure that you've got a successful sales funnel?
By tracking the right metrics.
Track sales funnel effectiveness

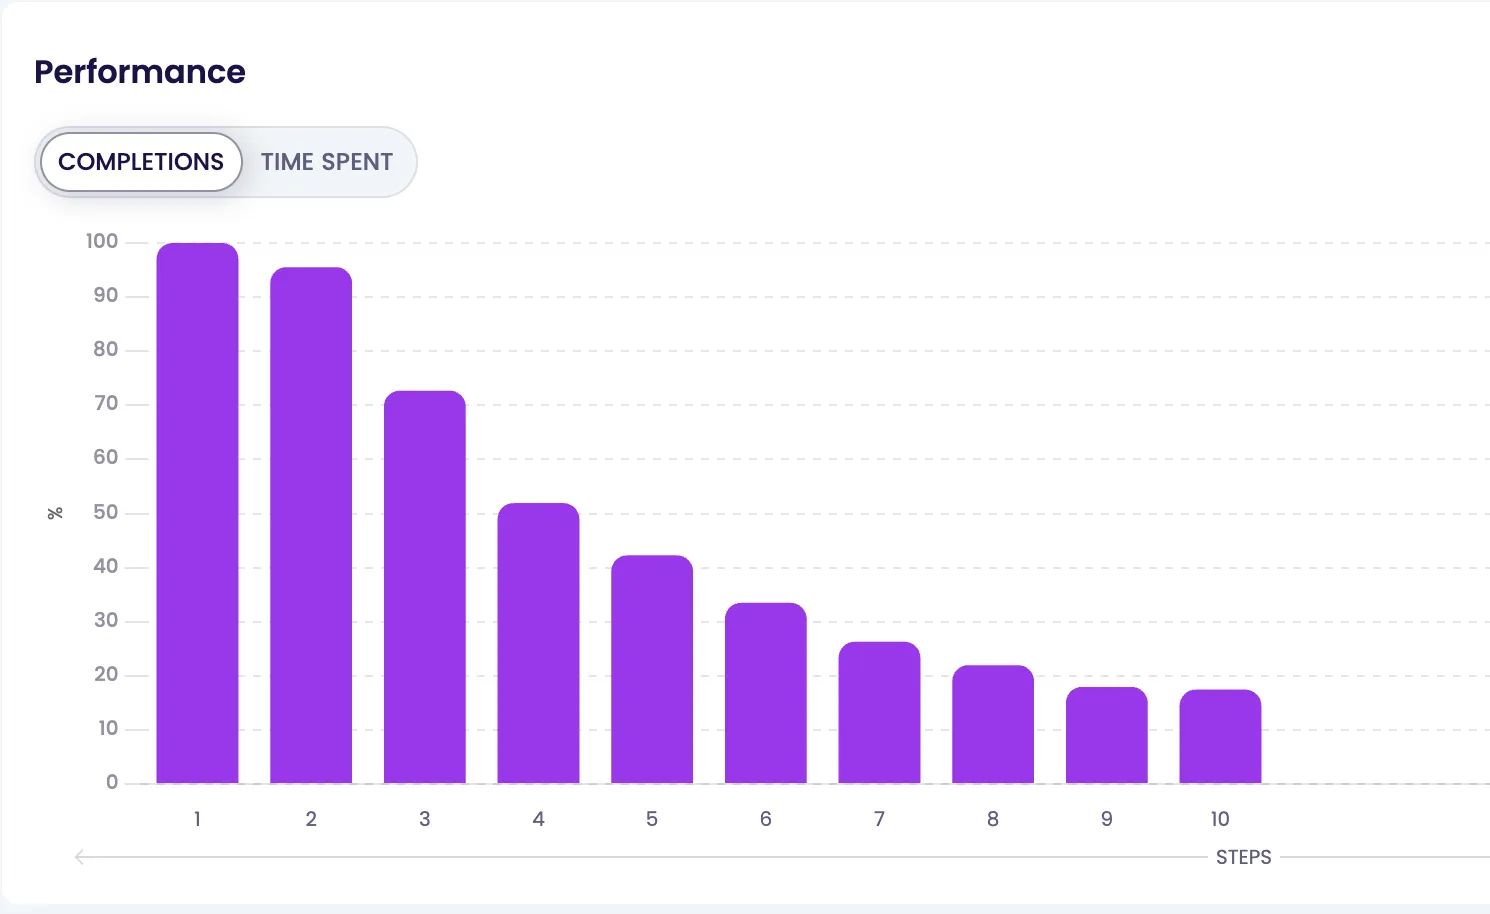
The most important thing you need to do is track a few key performance indicators. Here are some metrics that help to indicate the success of your sales funnel:
- Conversion Rates - Measuring this more specifically will give you an idea of how customers are moving through the funnel your funnel:
- Lead to trial conversion rate: Number of leads who sign up for a free trial right off the bat
- Demo to trial conversion rate: Number of leads who sign up for a free trial after witnessing the product demo
- Trial to sales conversion rate: Number of leads who convert to a paid plan after experiencing the free trial
- Revenue growth: The increase in revenue over time
- Customer churn rate: The percentage of users who left over a certain period
- Customer lifetime value: The amount of money a single customer will bring to your table over time
- Customer acquisition cost: The amount you have invested in converting a lead to a customer
- Sales Velocity: To measure how fast customers are moving through the funnel
- Monthly and Annual Recurring Revenue: To have an overview of the overall success of your product
Let's also look at a few best practices from experts in the field:
- Implement multi-touch attribution
Trevor Longino, Founder and CEO of CrowdTamers, says 'Sales funnels are often multi-channel and multi-touchpoint, involving interactions across various marketing and sales channels. To accurately track effectiveness, it's important to implement a multi-touch attribution model that assigns credit to the different touchpoints that contributed to a conversion. This enables you to understand the impact of each marketing activity on your funnel's success and allocate resources effectively.'
- See the bigger picture and fundamental goals
This suggestion comes from Vladislav Podolyako, Founder and CEO of Folderly. He says 'Obviously, you want to broaden each step of the funnel to get as many people through as possible. But always think of the big picture: will widening a given step actually lead to more sales, or could it backfire? Let's imagine a hypothetical scenario where you send an email saying you’ll gift a 100-year free subscription to anyone who clicks the link. The click-through rate might skyrocket, but will those clicks convert into real sales? Probably not.'
Before we wrap up, let's take a look at the SaaS sales funnel in action.
Examples of SaaS Sales Funnel
Here are some examples of SaaS sales funnels that show how a successful sales funnel works.
GetResponse

GetResponse is a SaaS company offering multiple email and marketing automation solutions to put your marketing efforts on autopilot.
They attract their audience with free plans, guides, and affiliate programs. Once the customer opts for the free plan, they're able to activate a 30-day free trial option allowing them to explore and seamlessly use all the product's premium features.
After the free trial, the user either has to upgrade or use the free version with limited features. For potential clients that don't convert to a premium plan, going back to the restrictive nature of the freemium version is likely to be the push they need to convert.
This is a good sales funnel example showing what the top, middle, and bottom of the funnel look like for GetResponse's clients.
ConvertKit

ConvertKit is powerful email marketing software has a lead generation and nurturing strategy worth talking about:
- Lots of educational content and resources (how-to blogs, podcasts, 'Creator University' online courses) for people interested in optimizing their conversions and overall sales effectiveness
- Affiliate program and Sponsor Network for creators, which means more people will be piloting their product and promoting its benefits
- Frequent webinars (live workshops) and guiding prospects through the purchasing process with ConvertKit Certified Experts
Apploye

Apploye is one of the prominent remote staff monitoring software that has managed quite some popularity in recent days especially in remote team communities.
- They attract & engage their customers with productivity related content through their websites initially.
- Then they hook their visitors with their software’s 10 days free trial.
- Meanwhile Apploye’s support members guide the visitors with every nitty gritty of the software’s usage. And human level interaction further helps them to understand the needs of the users and offer a perfect solution to the user base.
Wrapping Up
Vladislav, who we quoted earlier in this article, sums up the funnel-building process rather poetically:
"I recommend that every SaaS business first identifies the critical steps leading to customer conversion and builds a funnel around these. But remember, a sales funnel isn't just a pretty chart; it's a tale of trials and triumphs. So, document every test, every number. This diary becomes your treasure map, guiding you through the rough seas of marketing. By focusing on key steps and learning from your journey, you're setting sail for long-term success."
With sales funnels, you can tailor your messaging based on each lead's stage in the customer journey and provide targeted content that addresses their specific needs. It's crucial to carefully design your sales funnel as it can significantly impact your customer acquisition rate and cost.


.svg)

.webp)