This interactive demo was created free with Storylane in 2 minutes. Create your own demo
Start free
All Tutorials /Power BI

How to Create Relationships in Power BI

Updated on:
May 12, 2026
By:
Madhav Bhandari
Use this interactive demo to learn how to link tables and build relationships in Power BI.

Quick summary

Creating relationships in Power BI lets you connect multiple data tables so that your reports and visuals can accurately cross-reference and analyze data across sources. This step-by-step walkthrough shows you how to load tables and use the Model view to define and save table relationships in Power BI Desktop.


Steps

  1. Select a data source and add data to your report.
  2. Click 'Load' to load your tables into Power BI.
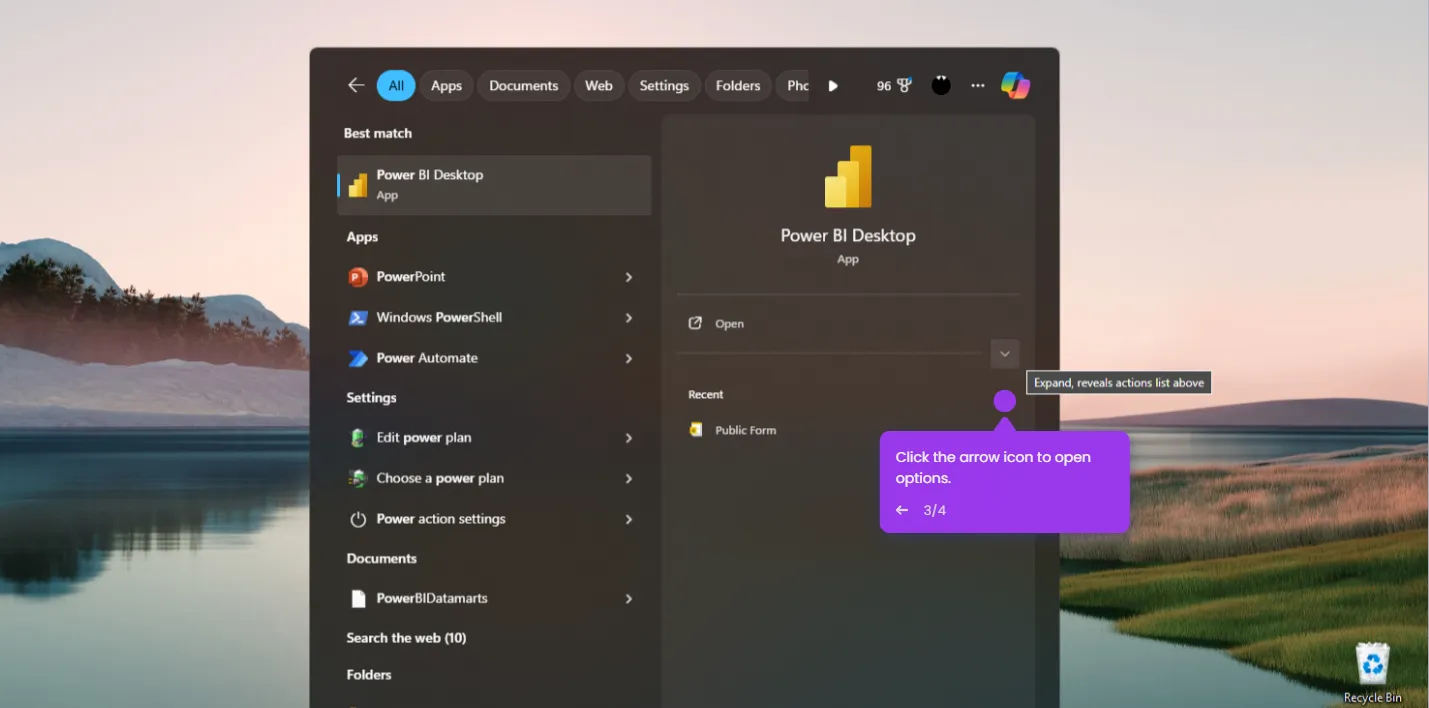
  3. Go to 'Model' view in the left navigation panel.
  4. Drag a field from one table to the matching field in another table to begin creating a relationship.
  5. In the 'New relationship' window, review Power BI's suggested relationship type, select one, and click 'Save'.
  6. Your relationship has been successfully created in Power BI.
📌 Why this matters

Creating relationships in Power BI is essential for building accurate, multi-table data models that power meaningful business intelligence reports. By linking tables through shared fields, analysts can perform cross-table calculations, use DAX measures effectively, and ensure that slicers and visuals filter data correctly across the entire report. Without properly defined table relationships, Power BI reports risk returning incorrect aggregations or missing data connections entirely. Mastering Power BI relationships is a foundational skill for anyone building dashboards or data models in Microsoft's business analytics platform.
Your product deserves an interactive demo
Start free
Similar Articles
Power BI

How to Uninstall Power BI

Madhav Bhandari
Director of Marketing @ Storylane
Power BI

How to Compare Two Measures in Power BI

Madhav Bhandari
Director of Marketing @ Storylane
Power BI

How to Compare Months in Power BI

Madhav Bhandari
Director of Marketing @ Storylane
No items found.
Platform
Interactive Demos
Sandbox Demos
Buyer Hub
RepX
Integrations
Solutions
Product Marketers
Growth & Demand Gen
Sales Reps & AEs
Presales & SEs
Customer Success
Product Managers
Customers
Demo Showcase
Customer Stories
Finer Demos Club
Features
Demo Signals
Personalization
Deal Intelligence
Resources
Blog
The Plot
Tutorials
Events & webinars
Help Docs
What’s New
Demo Dundies
Company
Careers
Pricing
Partners
Contact
Trust Center
Backed by
Chrome Extension Icon
Chrome extension
Download
Desktop app
Download
Built in San Francisco Bay Area - ©2026 Storylane
Privacy PolicyTerms & Conditions
X Corp (formerly Twitter)LinkedIn
This website uses cookies to ensure you get the best experience on our website. Learn More
Got it
This website uses cookies to ensure you get the best experience on our website. Learn More
Got it