A demo on your website is just the start. Discover a dozen other marketing use cases • May 26
Register for AMA
Talk to RepX
Book a demo
Explore Hub
Platform
Products
Demos
Guided interactive demos and sandbox environments
Hubs
All the demos and collateral your buyers need in one place
New!
RepX
New
Conversational agents to qualify and convert prospects
Features
Demo Signals
Deal Intelligence
Personalization
Integrations
Enterprise
Download
Chrome Extension
Desktop App
Figma Plugin
Explore
AI-powered Lily
Built for Enterprise
Solutions
Used by GTM teams
Marketing
Turn curiosity into conversions with self-guided demos
Sales
Close more deals faster with interactive demo experiences
Customers
Customer Showcase
Check out how 5000+ GTM teams win with Storylane
Customer Resources
Customer Stories
Finer Demos Club
Demo Kitchen
Demo Dundies
    Our executive team continues to rave about how well Storylane visualizes our own tool!
Emily Elizabeth
VP Marketing
    Storylane's by far the easiest and most reliable out of other competitors.
Martin Kurowski
Product Marketing Manager
    Intuitive, powerful, and easy to use platform.
Matt Slotten
Marketing
35
demos in 3 weeks
Michael DeMarco
Product Marketing Manager
Read Case Study
    It’s actually kind of shocking how fast it was for us.
Katie Fairbank
Director of Product Marketing
Read Case Study
Wall Of Love
Resources
Resources
The Plot
Blog
Help Docs
Webinars
What’s New
Featured
Report
The impact of interactive demos on conversion rates & time to convert
What’s New
Release notes
New!
Pricing
Start for free
Book a demo
Platform
Products
Demos
Guided interactive demos and sandbox environments
Hubs
All the demos and collateral your buyers need in one place
New!
RepX
New
Conversational agents to qualify and convert prospects
Features
Demo Signals
Deal Intelligence
Personalization
Integrations
Enterprise
Download
Chrome Extension
Desktop App
Figma Plugin
Explore
AI-powered Lily
Built for Enterprise
Solutions
Used by GTM teams
Marketing
Turn curiosity into conversions with self-guided demos
Sales
Close more deals faster with interactive demo experiences
Customers
Customer Showcase
Check out how 5000+ GTM teams win with Storylane
Customer Resources
Customer Stories
Finer Demos Club
Demo Kitchen
Demo Dundies
    Our executive team continues to rave about how well Storylane visualizes our own tool!
Emily Elizabeth
VP Marketing
    Storylane's by far the easiest and most reliable out of other competitors.
Martin Kurowski
Product Marketing Manager
    Intuitive, powerful, and easy to use platform.
Matt Slotten
Marketing
35
demos in 3 weeks
Michael DeMarco
Product Marketing Manager
Read Case Study
    It’s actually kind of shocking how fast it was for us.
Katie Fairbank
Director of Product Marketing
Read Case Study
Wall Of Love
Resources
Resources
The Plot
Blog
Help Docs
Webinars
What’s New
Featured
Report
The impact of interactive demos on conversion rates & time to convert
What’s New
Release notes
New!
Pricing
Login
Start for free
Book a demo
It’s happening! Demo Dundies is back with Season 2.
Nominate your best demos
This interactive demo was created free with Storylane in 2 minutes. Create your own demo
Start free
All Tutorials /Coda

How to Create Progress Bars in Coda

Updated on:
May 12, 2026
By:
Madhav Bhandari
Use this interactive demo to learn how to build visual progress bars inside a Coda table.

Quick summary

Coda lets you create progress bars directly inside a table column by setting the column type to Progress. This built-in feature gives teams a fast, no-code way to visualize task completion or metric tracking without leaving their Coda document.


Steps

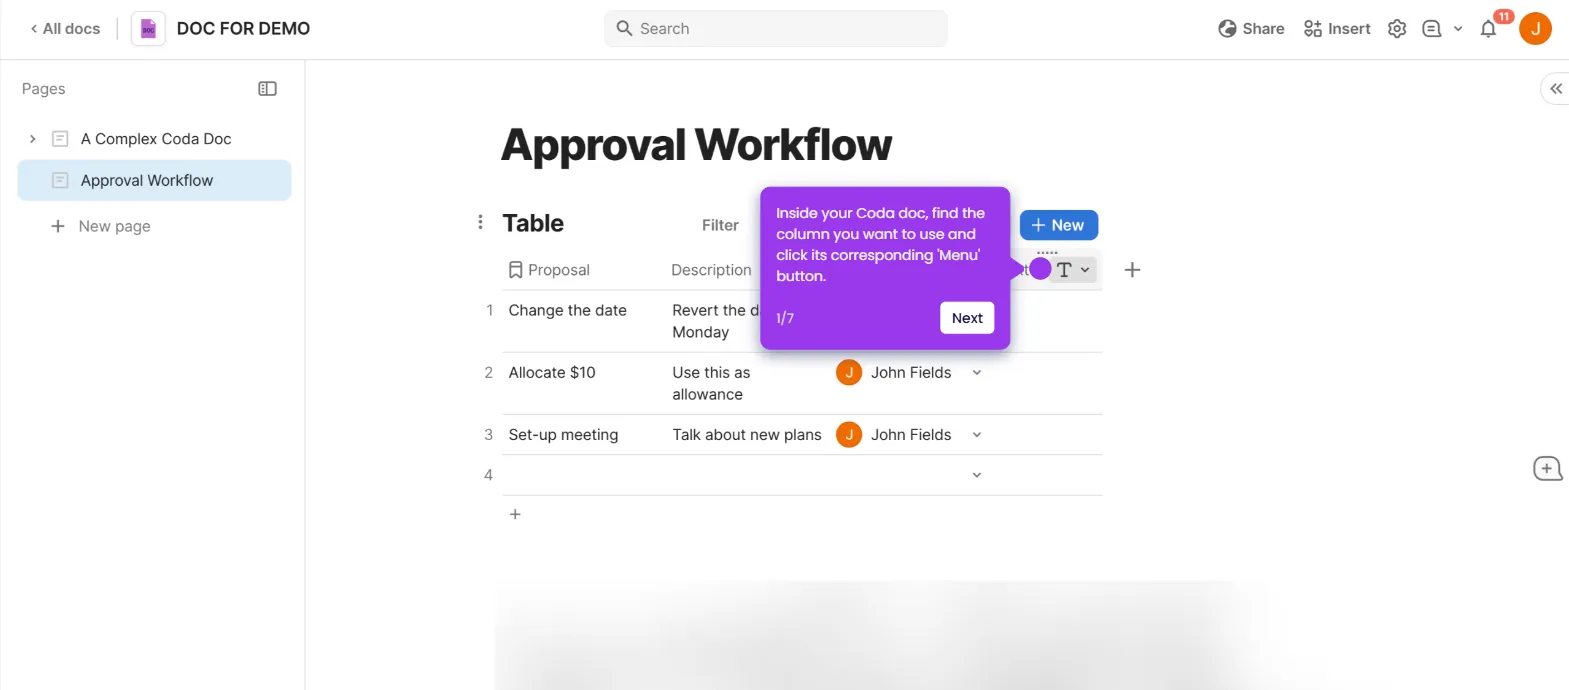
  1. Open your Coda document, navigate to your table, and click the add column icon to insert a new column.
  2. Select Text as the initial column type from the type picker.
  3. Name your column to label the progress bar field appropriately.
  4. Change the column type to Number using the column settings.
  5. Select Progress from the number format options to convert the column into a progress bar.
  6. Your progress bars are now active — customize them further based on your specific tracking needs.

📌 Why this matters

Progress bars in Coda transform raw numeric data into instant visual indicators of task or project completion, making it easier for teams to track status at a glance. Because Coda's Progress column type requires no formulas or third-party tools, anyone can set up visual tracking in seconds directly inside their existing tables. This feature is especially valuable for project managers, ops teams, and knowledge workers who need lightweight, built-in reporting without switching to a separate dashboard tool. Adding progress bars to a Coda table reduces manual status updates and keeps collaborative workspaces clear and actionable.
Your product deserves an interactive demo
Start free
Similar Articles
Coda

How to Set Up Team Billing in Coda

Madhav Bhandari
Director of Marketing @ Storylane
Coda

How to Use Coda’s REST API

Madhav Bhandari
Director of Marketing @ Storylane
Coda

How to Create Approval Workflows in Coda

Madhav Bhandari
Director of Marketing @ Storylane
No items found.
Platform
Demos
RepX
Hubs
Integrations
Solutions
Marketing
Sales
Features
Demo Signals
Personalization
Deal Intelligence
Resources
Blog
Tutorials
Help Docs
What’s New
Demo Dundies
Customers
Demo Showcase
Customer Stories
Finer Demos Club
Company
Careers
Pricing
Partners
Contact
Trust Center
Backed by
Chrome Extension Icon
Chrome extension
Download
Desktop app
Download
Built in San Francisco Bay Area - ©2026 Storylane
Privacy PolicyTerms & Conditions
X Corp (formerly Twitter)LinkedIn
This website uses cookies to ensure you get the best experience on our website. Learn More
Got it
This website uses cookies to ensure you get the best experience on our website. Learn More
Got it