Here’s an essential guide to help you get started:
- Open Power BI Desktop and click on the 'Blank report'.
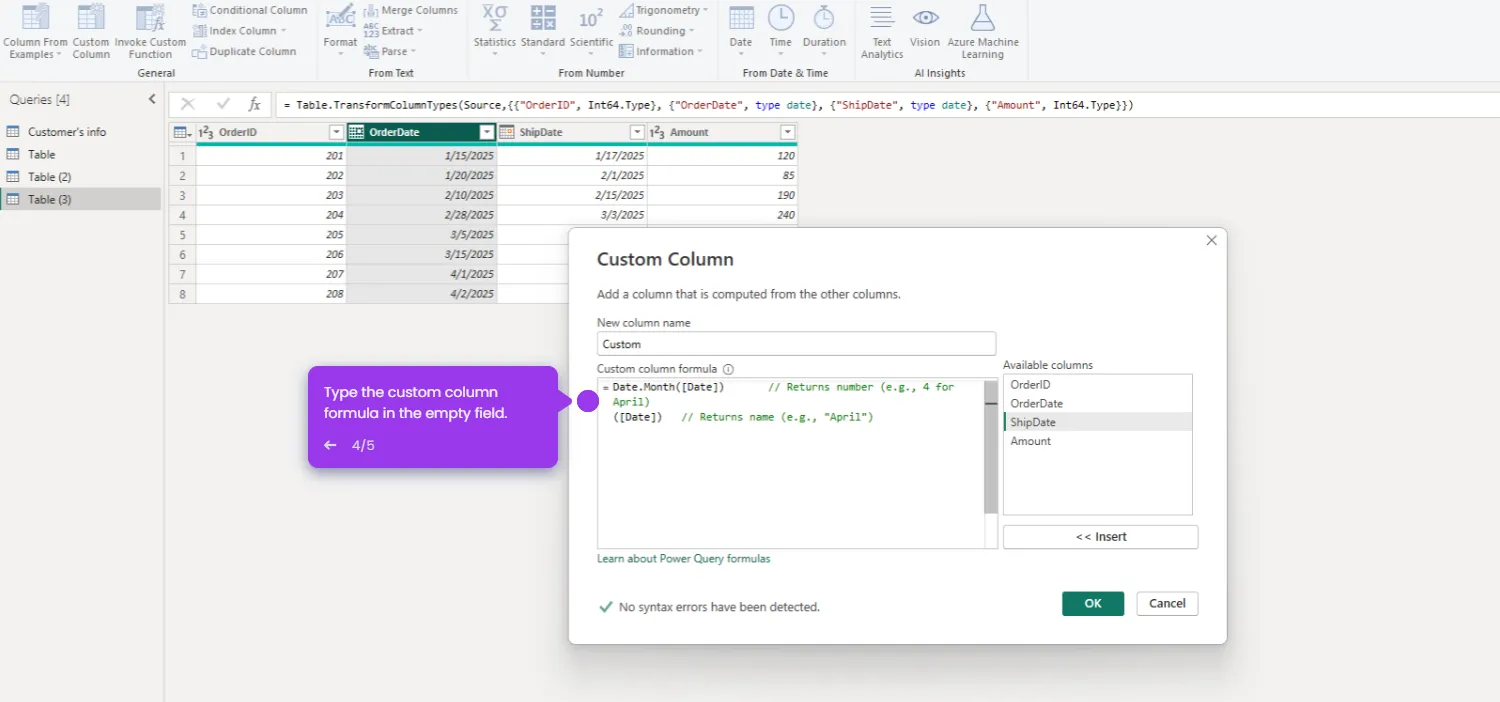
- Select a data source and load the data into Power BI.
- Select the table and click 'Load'.
- Navigate to the 'Visualizations' pane.
- Select your visual to visualize your data.
- Go to the 'Data' pane.
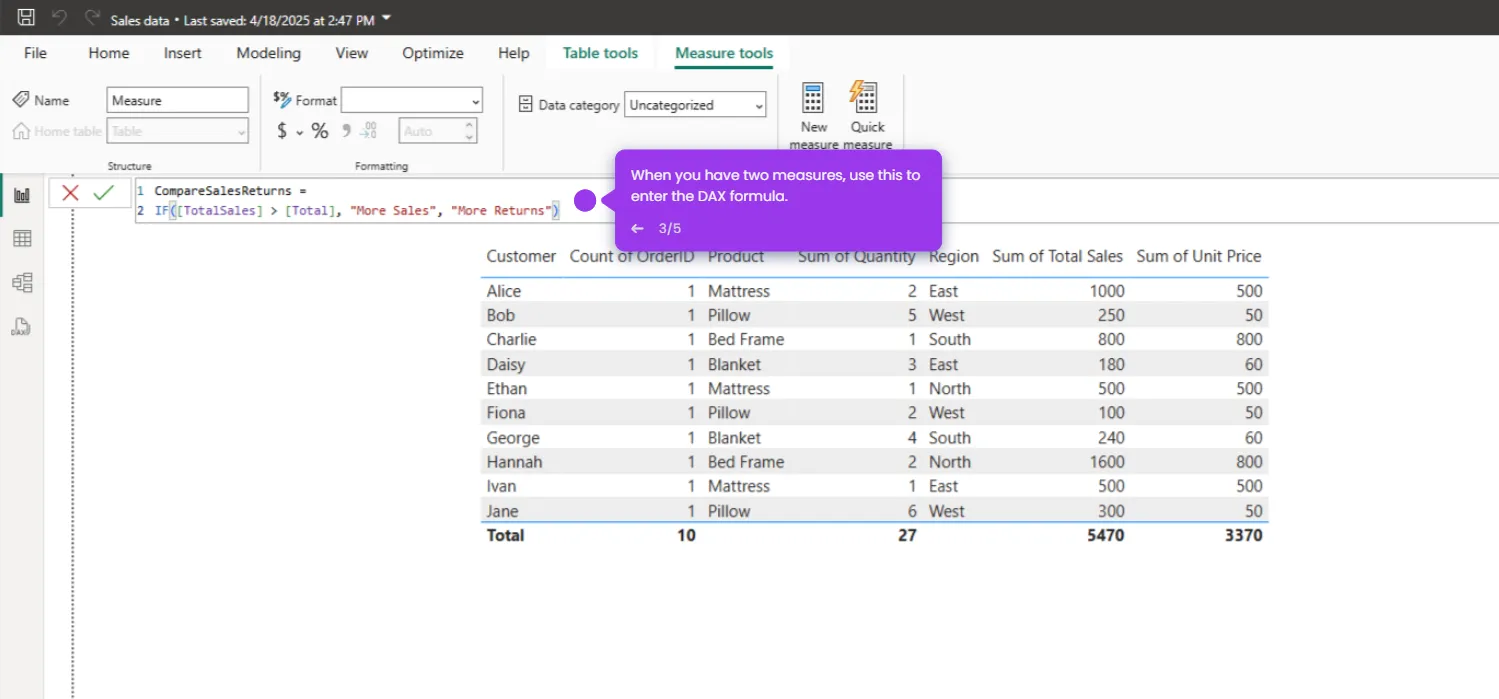
- After importing and preparing the data, drag fields from your data model to the report canvas to create visualizations.
- With these steps, you should be able to effectively visualize data in Power BI, creating insightful and interactive reports.

.svg)
.svg)


