Here’s how to do it:
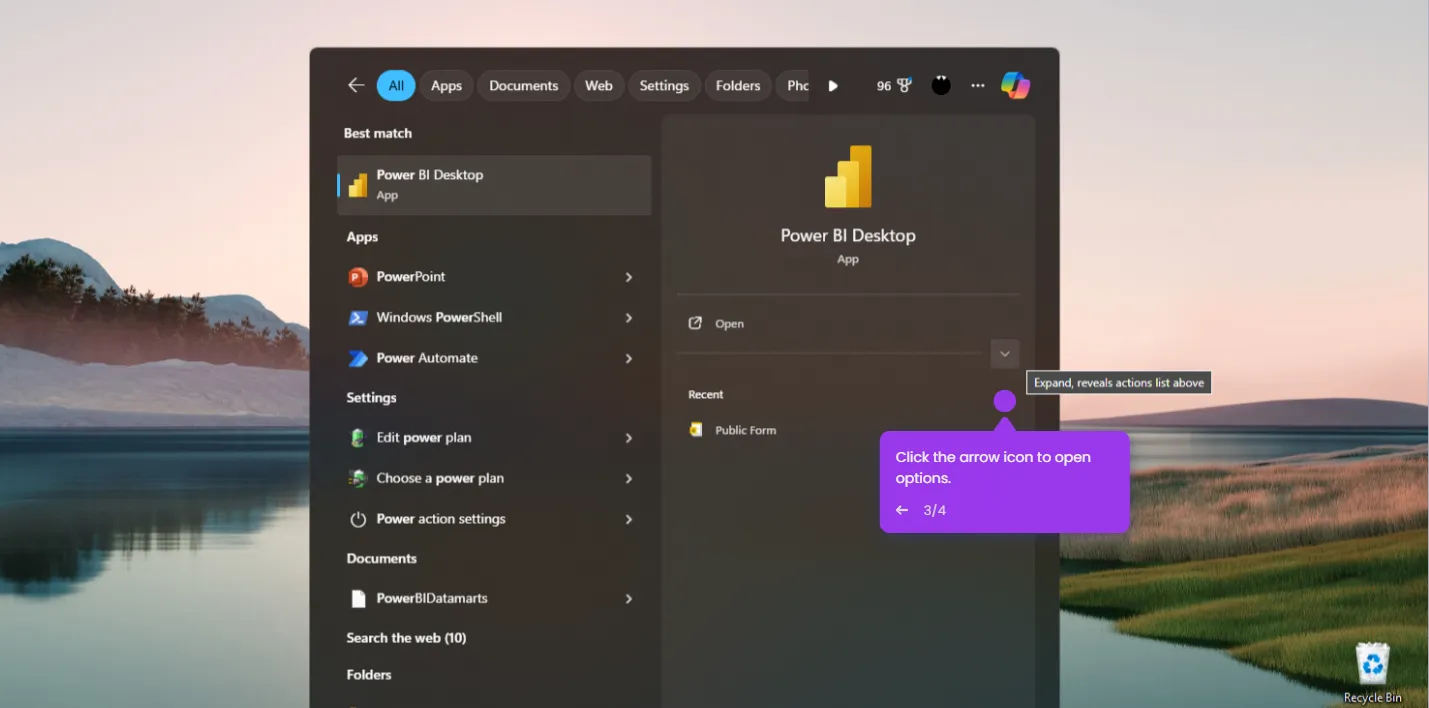
- Launch Power BI Desktop and click 'Blank report' to start with Power BI.
- You’ll see a home screen where you can 'Get Data' and click on it.
- Select a data source for your report.
- Select the table and click 'Load'.
- Power BI loads it into a data model. Then, go to the 'Visualizations' pane and select a visualization for your data.
- Drag fields onto the canvas.
- Click the save icon to save your report locally.
- When ready, click 'Publish' to send it to the Power BI Service for sharing.

.svg)
.svg)


