To recreate a visual in Power BI, whether you're redesigning from scratch or replicating an existing chart, here’s a clear step-by-step guide:
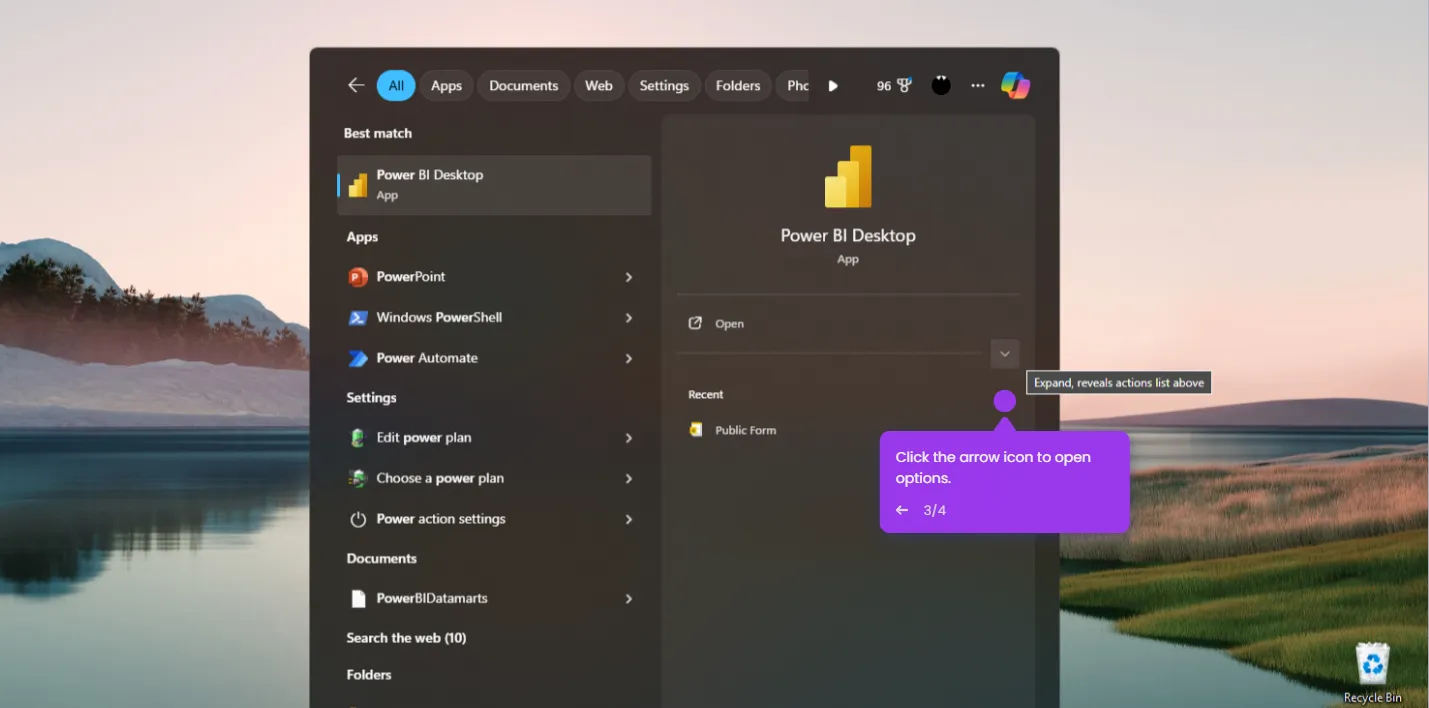
- Open your file in Power BI Desktop.
- From the 'Visualizations' pane on the right. Choose the type of visual you want.
- Drag relevant data into the correct areas in the' Data' pane.
- Click the visual, then go to the 'Format' pane.
- Customize the visual based on your needs.
- Click the save icon if you're satisfied with your visual.

.svg)
.svg)


