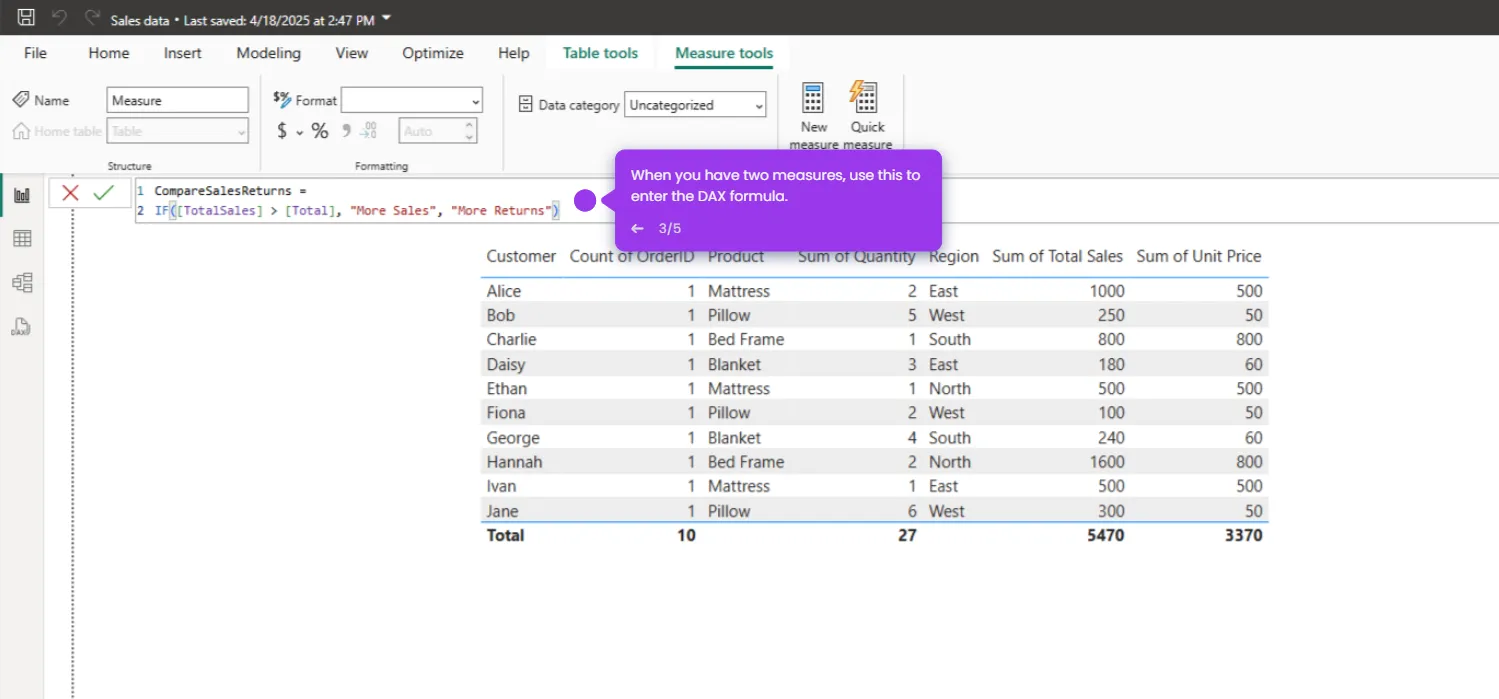
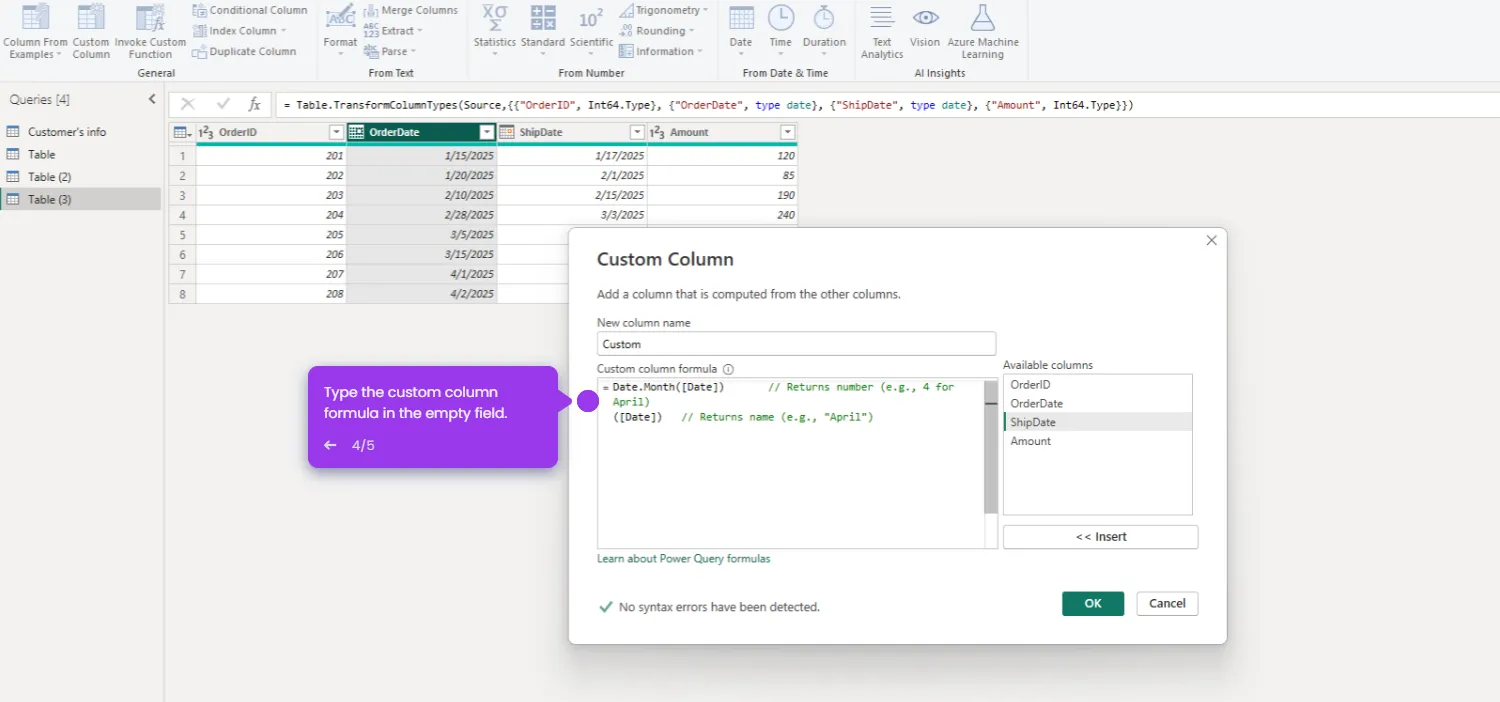
Here’s the step-by-step guide:
- Launch Power BI Desktop and select a source to add your data.
- Make sure you have a visual and click on the visual.
- Go to the 'Filter' pane.
- Drag the field you want to filter by into the 'Filters' area.
- Set the 'Filter type' as 'Top N'.
- In the 'Show items' field, choose 'Top' and type '10'.
- In the 'By value' field, drag the measure you want to filter.
- Click 'Apply filter'.
- Now, your visual will only show the Top 10 based on your specified measure.

.svg)
.svg)


