Here’s how to do it:
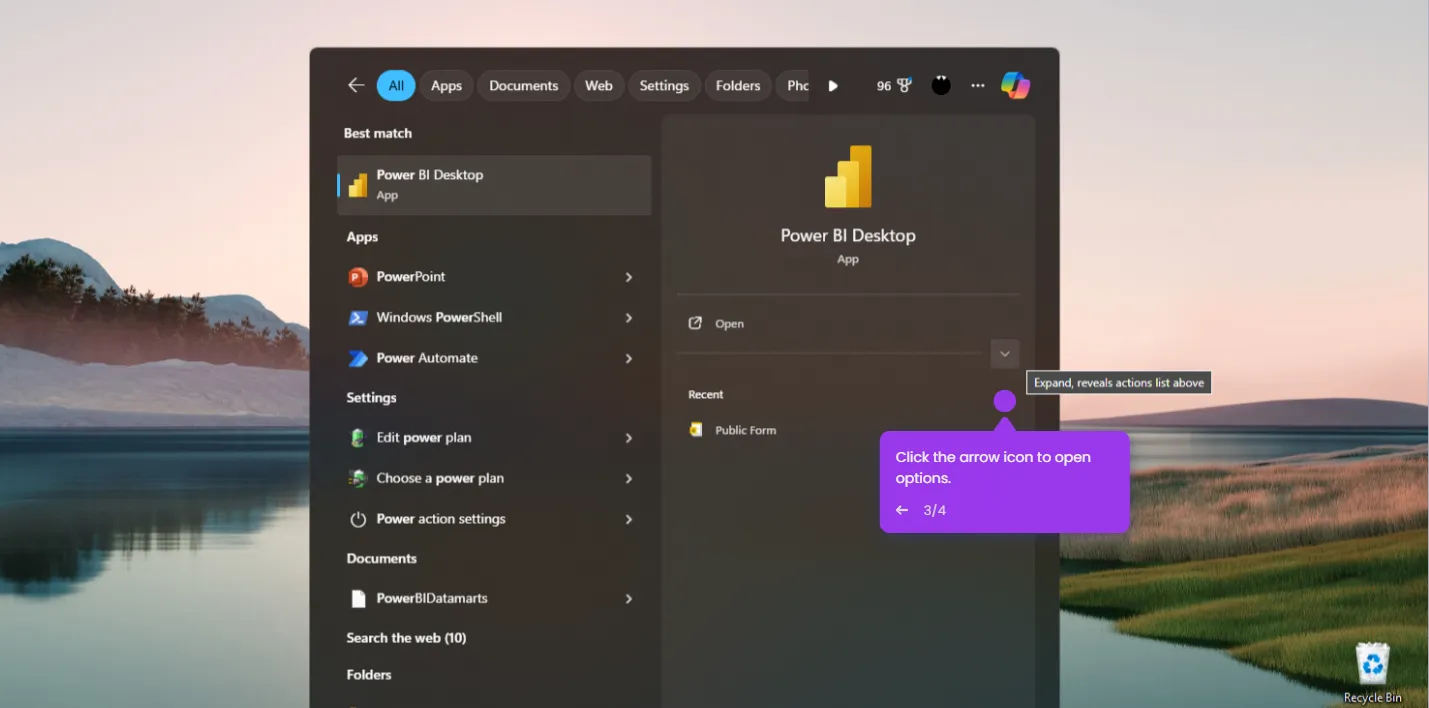
- Let's start by opening your Power BI report where you want to apply filters.
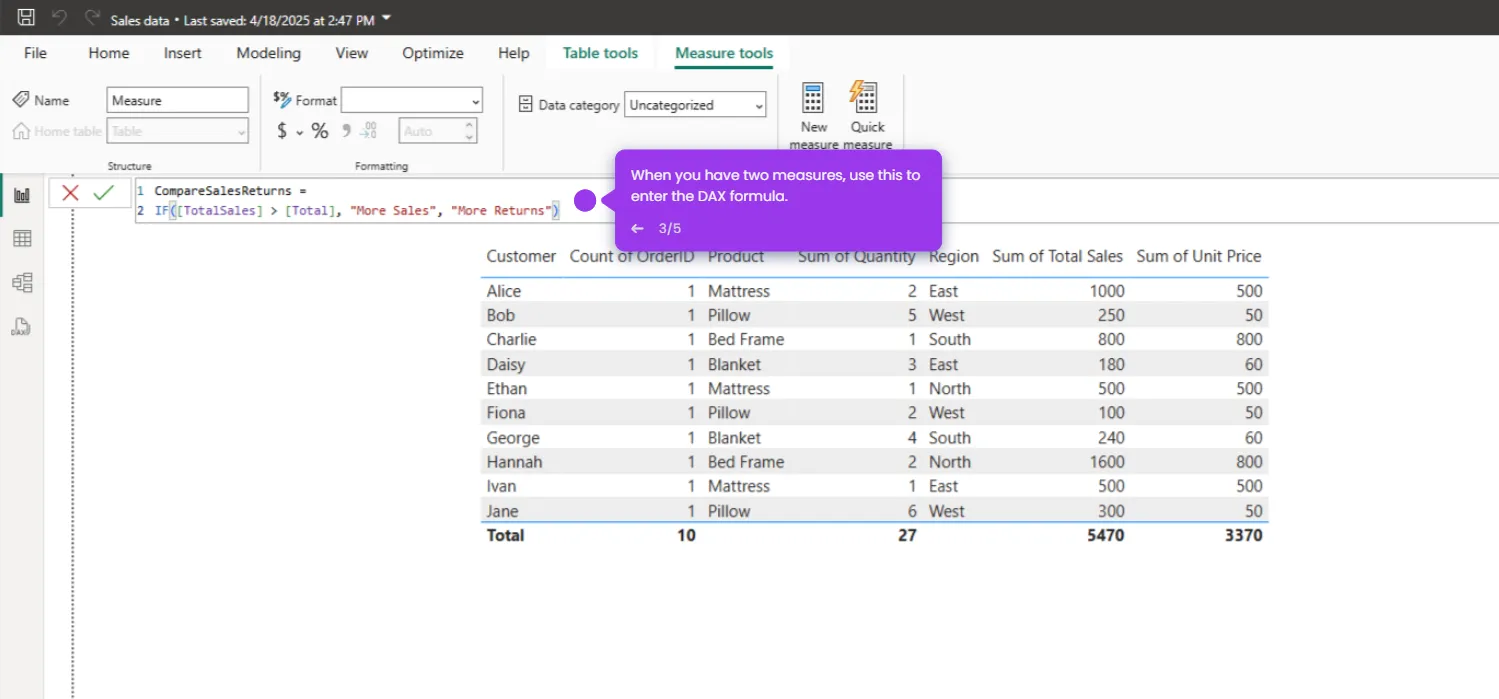
- Click on the visual you want to filter.
- Look for the 'Filters' pane on the right side of your screen.
- In the 'Filters' pane, drag the field you want to filter by, then select the specific values you want to include in your visualization.
- You've done it! Your visual now shows exactly the data you need. You can add multiple filters to really zero in on those insights.

.svg)
.svg)


