Here’s how to do it:
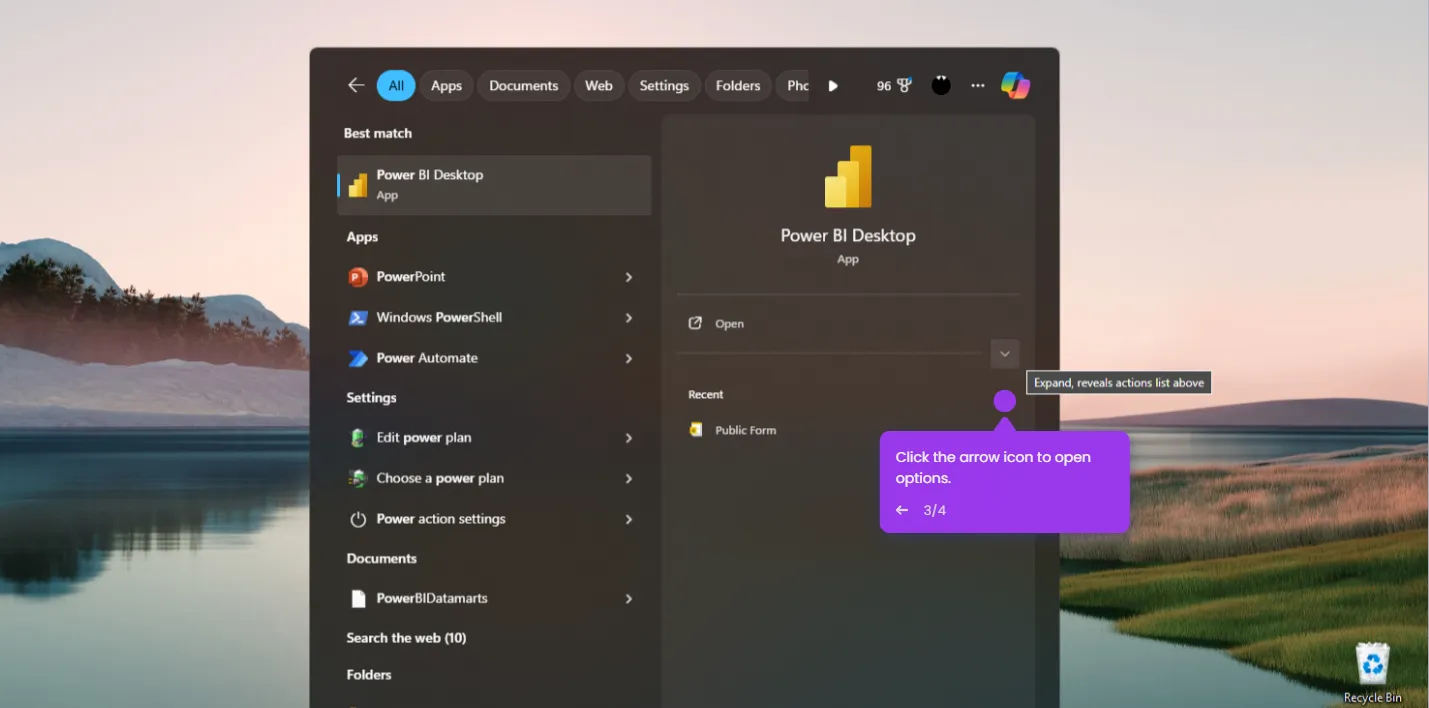
- Let's open the Power BI report where you want to create your drill-down functionality.
- In the 'Fields' pane, find your date field and check the box to enable the 'Date Hierarchy' (Year > Quarter > Month > Day).
- Now, click on the 'Visualizations' pane on the right side of your screen.
- Select a visual type that supports drill-down functionality - charts like bar, column, line, or tables work great for this.
- Click on your visual to select it. Look for the drill controls in the top-right corner - they look like tiny arrows. Click the 'Drill Down' icon (the one with a forked arrow pointing downward).
- Nice work! Your drill-down is now active. Try clicking on a data point to drill deeper into your hierarchy levels.

.svg)
.svg)


