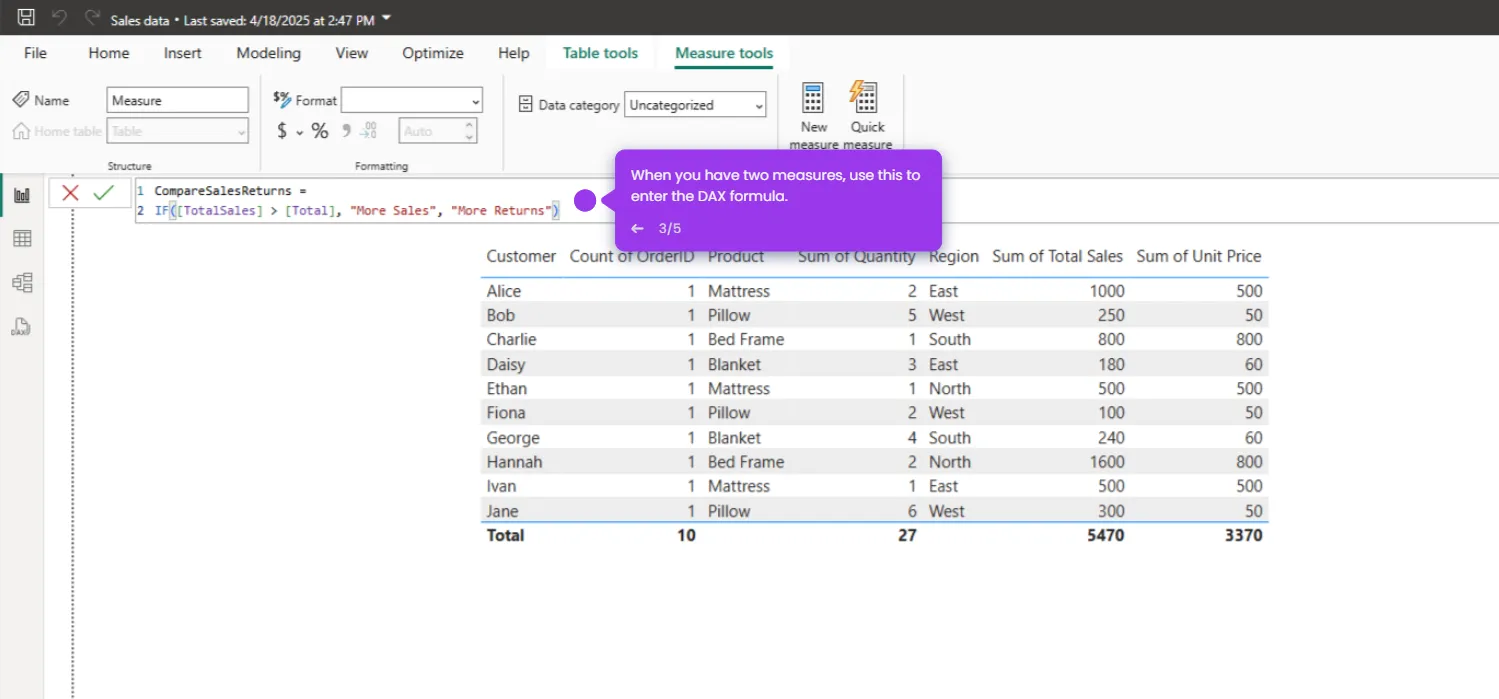
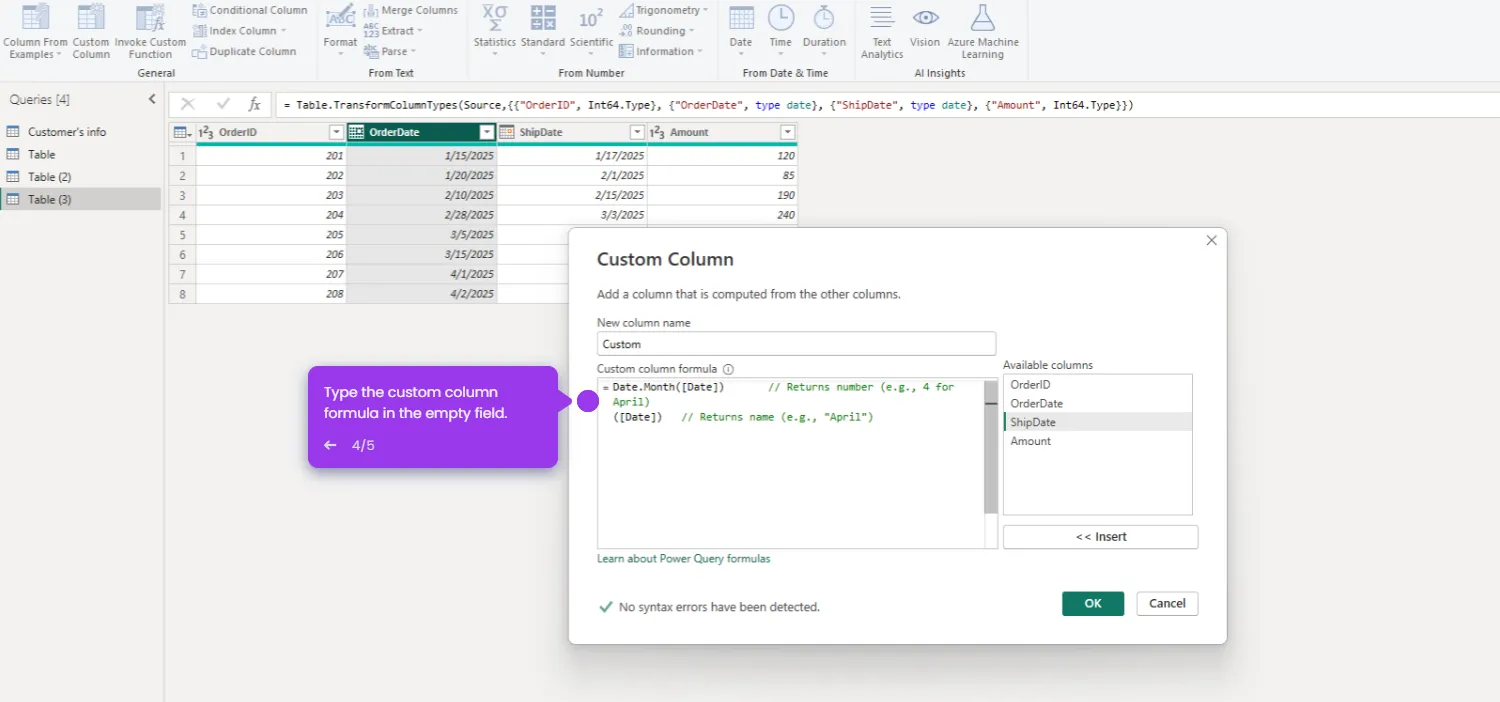
Creating a Waterfall chart in Power BI is super simple. Follow these steps:
- Open your Power BI report and select the visual.
- Go to the 'Visualizations' pane.
- Click on the 'Waterfall Chart' icon.
- In the Fields pane, drag and drop fields.
- By following these steps, you can create a Waterfall chart in Power BI.

.svg)
.svg)


