This tutorial shows how to save a chart or visualization as a master item in Qlik Sense so you can reuse it consistently across multiple sheets.
Notes:
- Master visualizations are available in Qlik Sense apps with Edit mode access.
- Any visualization type can be saved as a master item.
- Changes to a master visualization automatically apply wherever it is used.
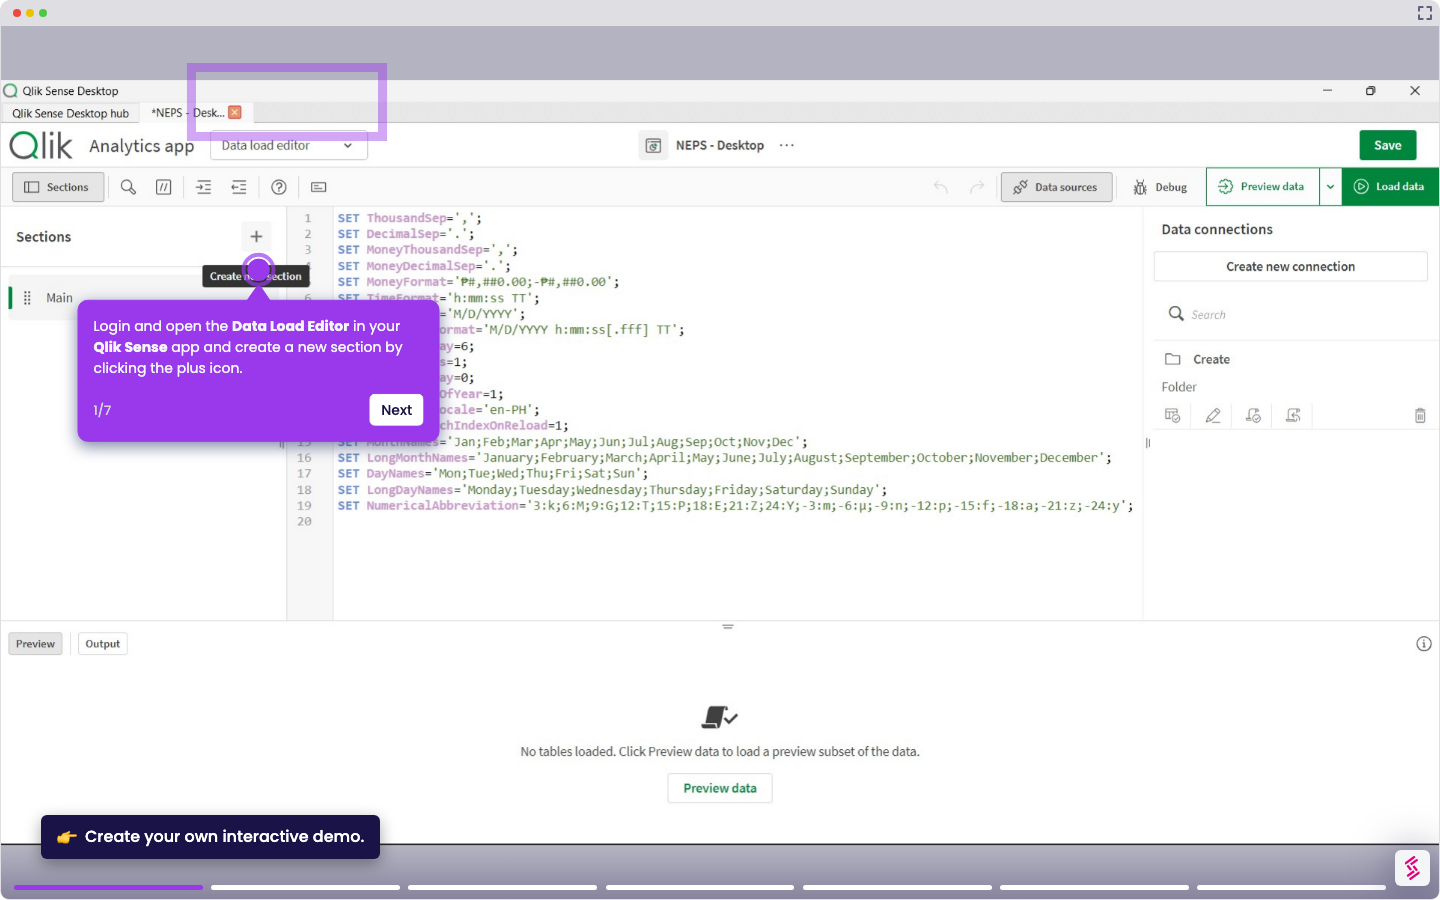
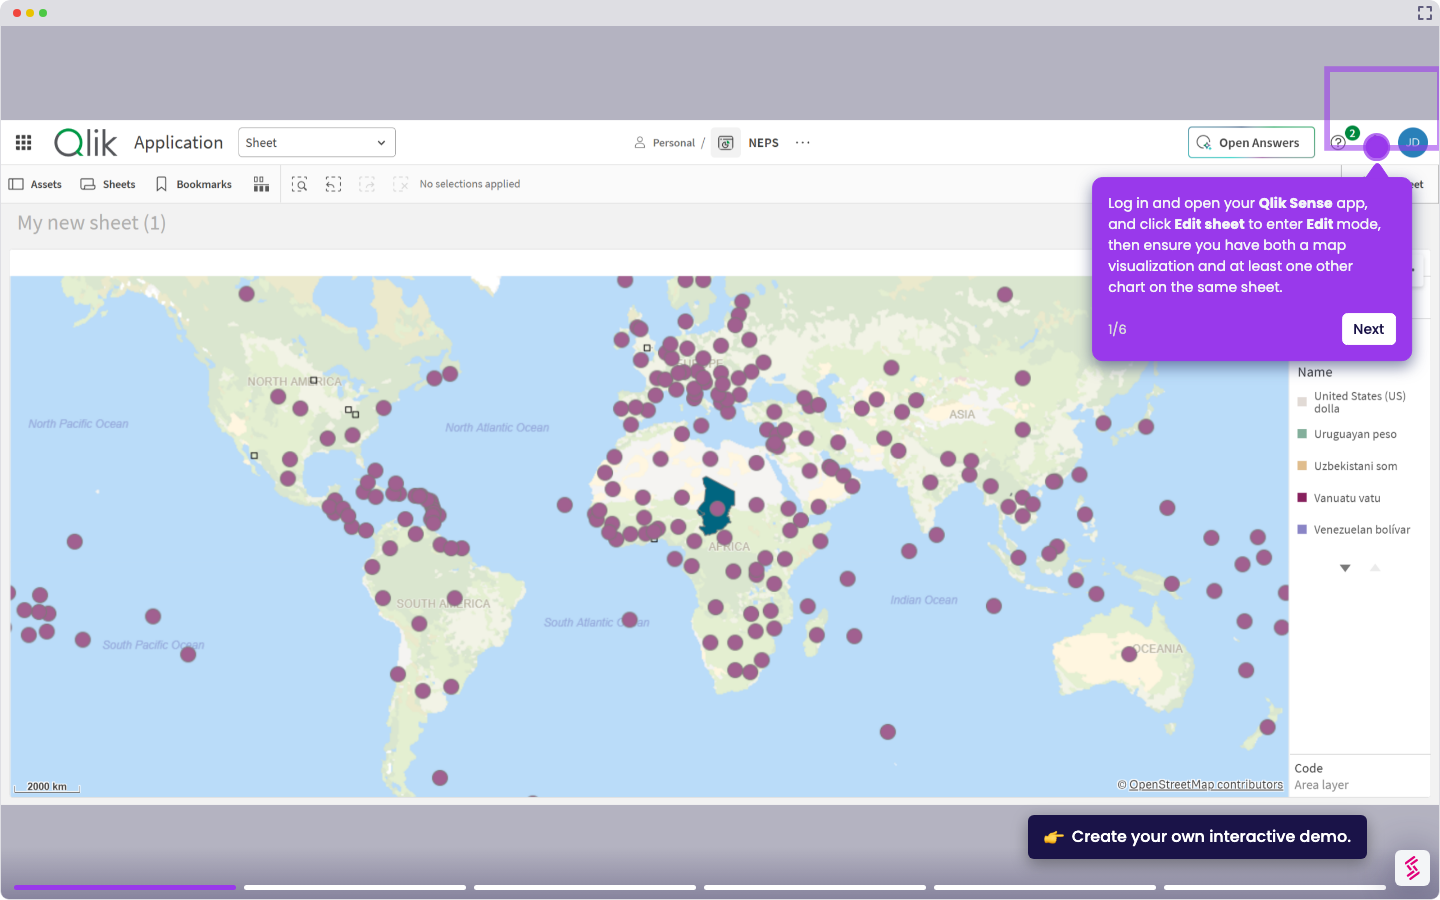
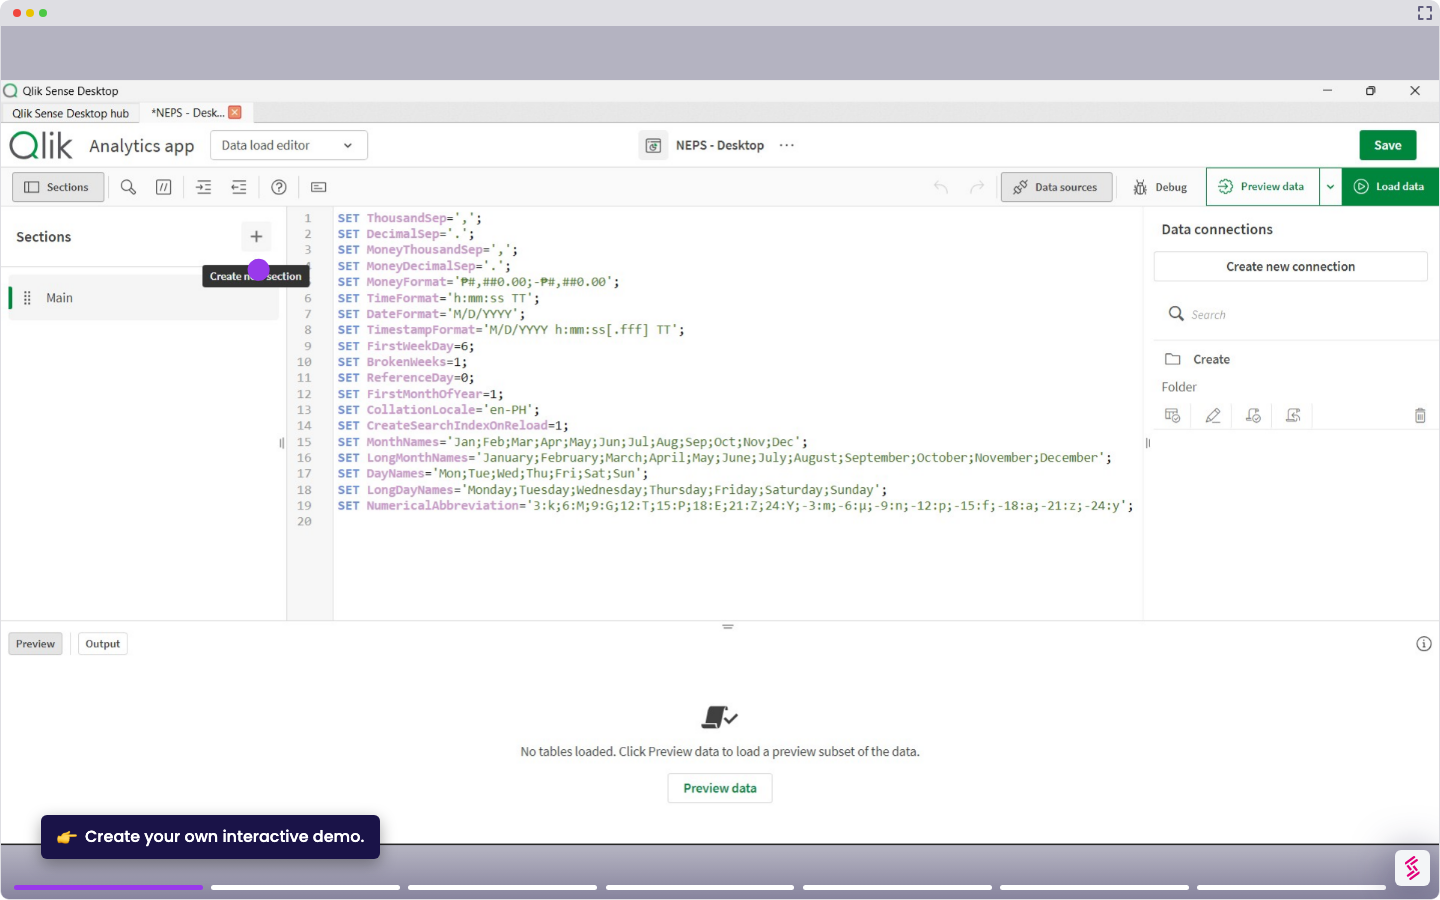
- Log in and open your Qlik Sense app, and click Edit sheet in the top right to enter Edit mode.
- On any sheet, right-click an existing visualization and select Add to master items from the context menu.
- In the dialog that appears, enter a name and optional description for the master visualization (for example, "Average Stock").
- Click Add to save it. The visualization is now stored in the Master items panel.
- To reuse it, open any sheet in Edit mode, then click Master items in the Assets panel on the left and drag your saved visualization onto the sheet.