This tutorial shows how to build a map visualization in Qlik Sense using location data to display geographic distributions across your dataset.
Notes:
- Your data must include a location field such as country, city, or coordinates (latitude/longitude).
- Qlik Sense uses map layers to display data; point, area, and line layers are available.
- Map visualizations require an active internet connection to render the base map tiles.
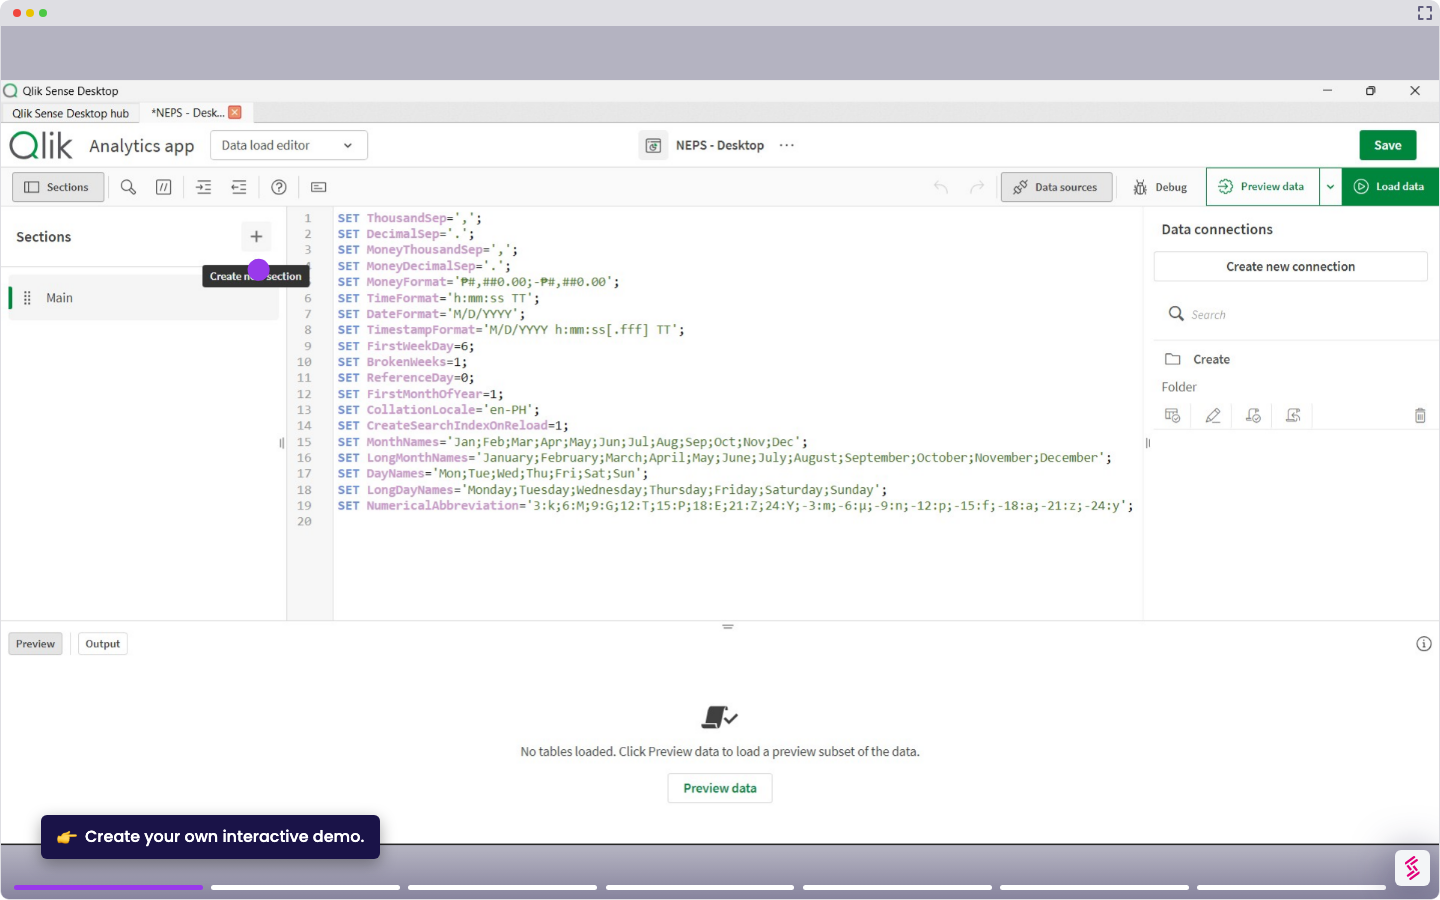
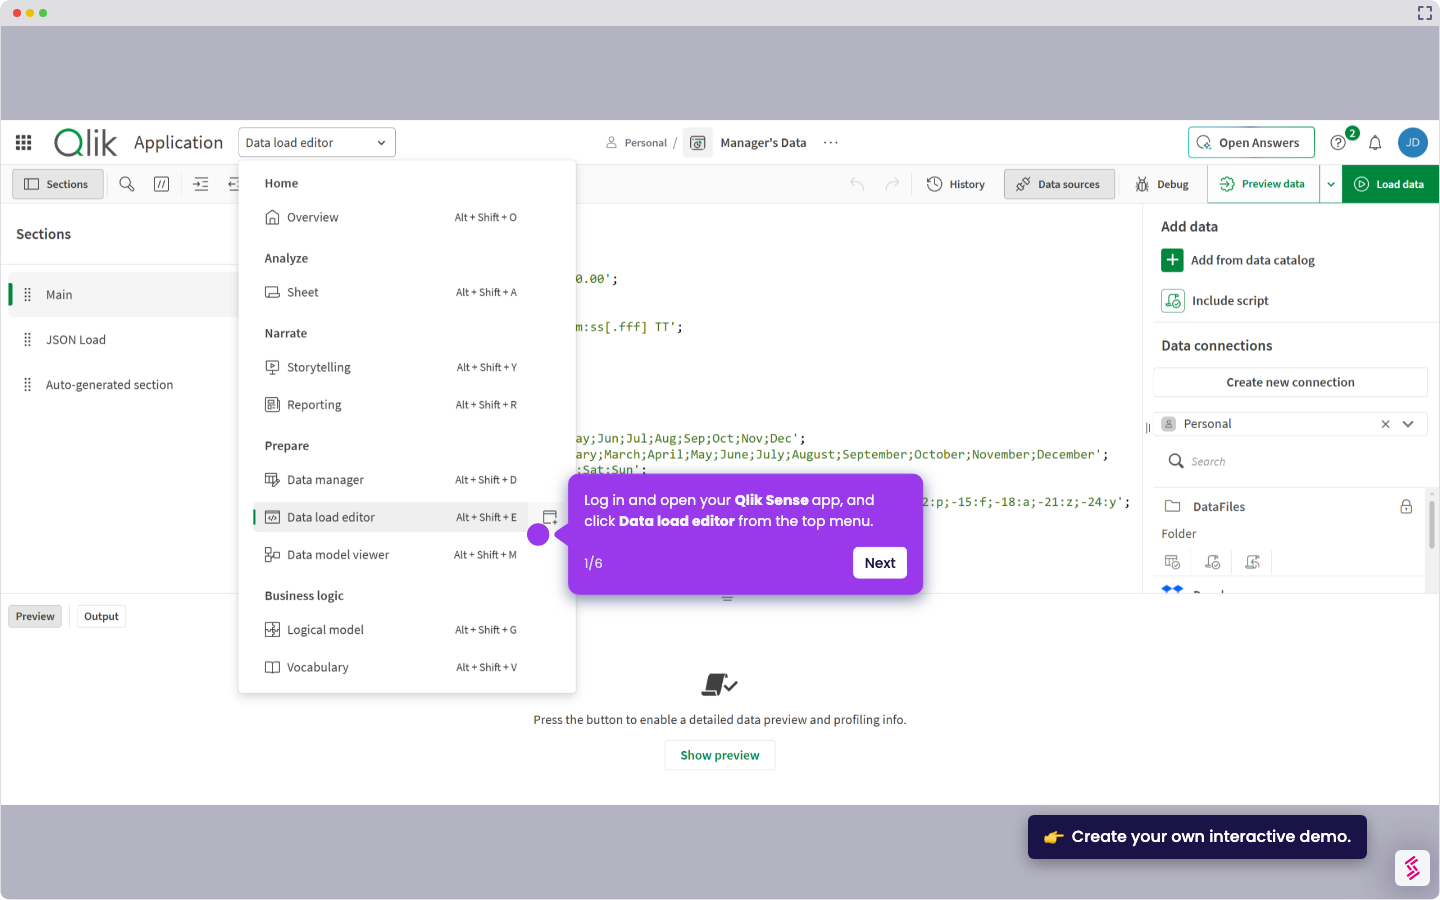
- Log in and open your Qlik Sense app, and click Edit sheet in the top right to enter Edit mode.
- Click the blank area on a sheet or drag the Map visualization from the Charts panel on the left onto the sheet.
- In the map properties panel on the right, click Add layer and select Point layer, Chart layer, or Area layer from the menu.
- Under the Dimensions section, click Add and select your location field (for example, Code, Country, or Industry).
- Under the Measures section, click Add and select the metric you want to display on the map, for example, Number of Employees for Avg([Number of Employees]).
- Adjust the Layer style settings - such as size, color, and opacity - to make the points readable at a glance.
- Click Edit sheet to exit Edit mode and interact with your map by hovering over data points to view details.