How Respond.io increased trial clicks by 162% • 23rd April
Save your seat
Talk to RepX
Book a demo
Explore Hub
Platform
Products
Demos
Guided interactive demos and sandbox environments
Hubs
All the demos and collateral your buyers need in one place
New!
RepX
New
Conversational agents to qualify and convert prospects
Features
Demo Signals
Deal Intelligence
Personalization
Integrations
Enterprise
Download
Chrome Extension
Desktop App
Figma Plugin
Explore
AI-powered Lily
Built for Enterprise
Solutions
Used by GTM teams
Marketing
Turn curiosity into conversions with self-guided demos
Sales
Close more deals faster with interactive demo experiences
Customers
Customer Showcase
Check out how 5000+ GTM teams win with Storylane
Customer Resources
Customer Stories
Finer Demos Club
Demo Kitchen
Demo Dundies
    Our executive team continues to rave about how well Storylane visualizes our own tool!
Emily Elizabeth
VP Marketing
    Storylane's by far the easiest and most reliable out of other competitors.
Martin Kurowski
Product Marketing Manager
    Intuitive, powerful, and easy to use platform.
Matt Slotten
Marketing
35
demos in 3 weeks
Michael DeMarco
Product Marketing Manager
Read Case Study
    It’s actually kind of shocking how fast it was for us.
Katie Fairbank
Director of Product Marketing
Read Case Study
Wall Of Love
Resources
Resources
The Plot
Blog
Help Docs
Webinars
What’s New
Featured
Report
The impact of interactive demos on conversion rates & time to convert
What’s New
Release notes
New!
Pricing
Start for free
Book a demo
Platform
Products
Demos
Guided interactive demos and sandbox environments
Hubs
All the demos and collateral your buyers need in one place
New!
RepX
New
Conversational agents to qualify and convert prospects
Features
Demo Signals
Deal Intelligence
Personalization
Integrations
Enterprise
Download
Chrome Extension
Desktop App
Figma Plugin
Explore
AI-powered Lily
Built for Enterprise
Solutions
Used by GTM teams
Marketing
Turn curiosity into conversions with self-guided demos
Sales
Close more deals faster with interactive demo experiences
Customers
Customer Showcase
Check out how 5000+ GTM teams win with Storylane
Customer Resources
Customer Stories
Finer Demos Club
Demo Kitchen
Demo Dundies
    Our executive team continues to rave about how well Storylane visualizes our own tool!
Emily Elizabeth
VP Marketing
    Storylane's by far the easiest and most reliable out of other competitors.
Martin Kurowski
Product Marketing Manager
    Intuitive, powerful, and easy to use platform.
Matt Slotten
Marketing
35
demos in 3 weeks
Michael DeMarco
Product Marketing Manager
Read Case Study
    It’s actually kind of shocking how fast it was for us.
Katie Fairbank
Director of Product Marketing
Read Case Study
Wall Of Love
Resources
Resources
The Plot
Blog
Help Docs
Webinars
What’s New
Featured
Report
The impact of interactive demos on conversion rates & time to convert
What’s New
Release notes
New!
Pricing
Login
Start for free
Book a demo
It’s happening! Demo Dundies is back with Season 2.
Nominate your best demos
This interactive demo was created free with Storylane in 2 minutes. Create your own demo
Start free
All Tutorials /Jira

How to Calculate Sprint Velocity in Jira

Updated on:
May 11, 2026
By:
Madhav Bhandari
Use this interactive demo to learn how to measure sprint velocity using the Jira Velocity Chart.

Quick summary

Sprint velocity in Jira is calculated by navigating to the Velocity Chart under Reports, which displays committed vs. completed story points across multiple sprints. Teams use this chart to track delivery consistency and improve future sprint planning.


Steps

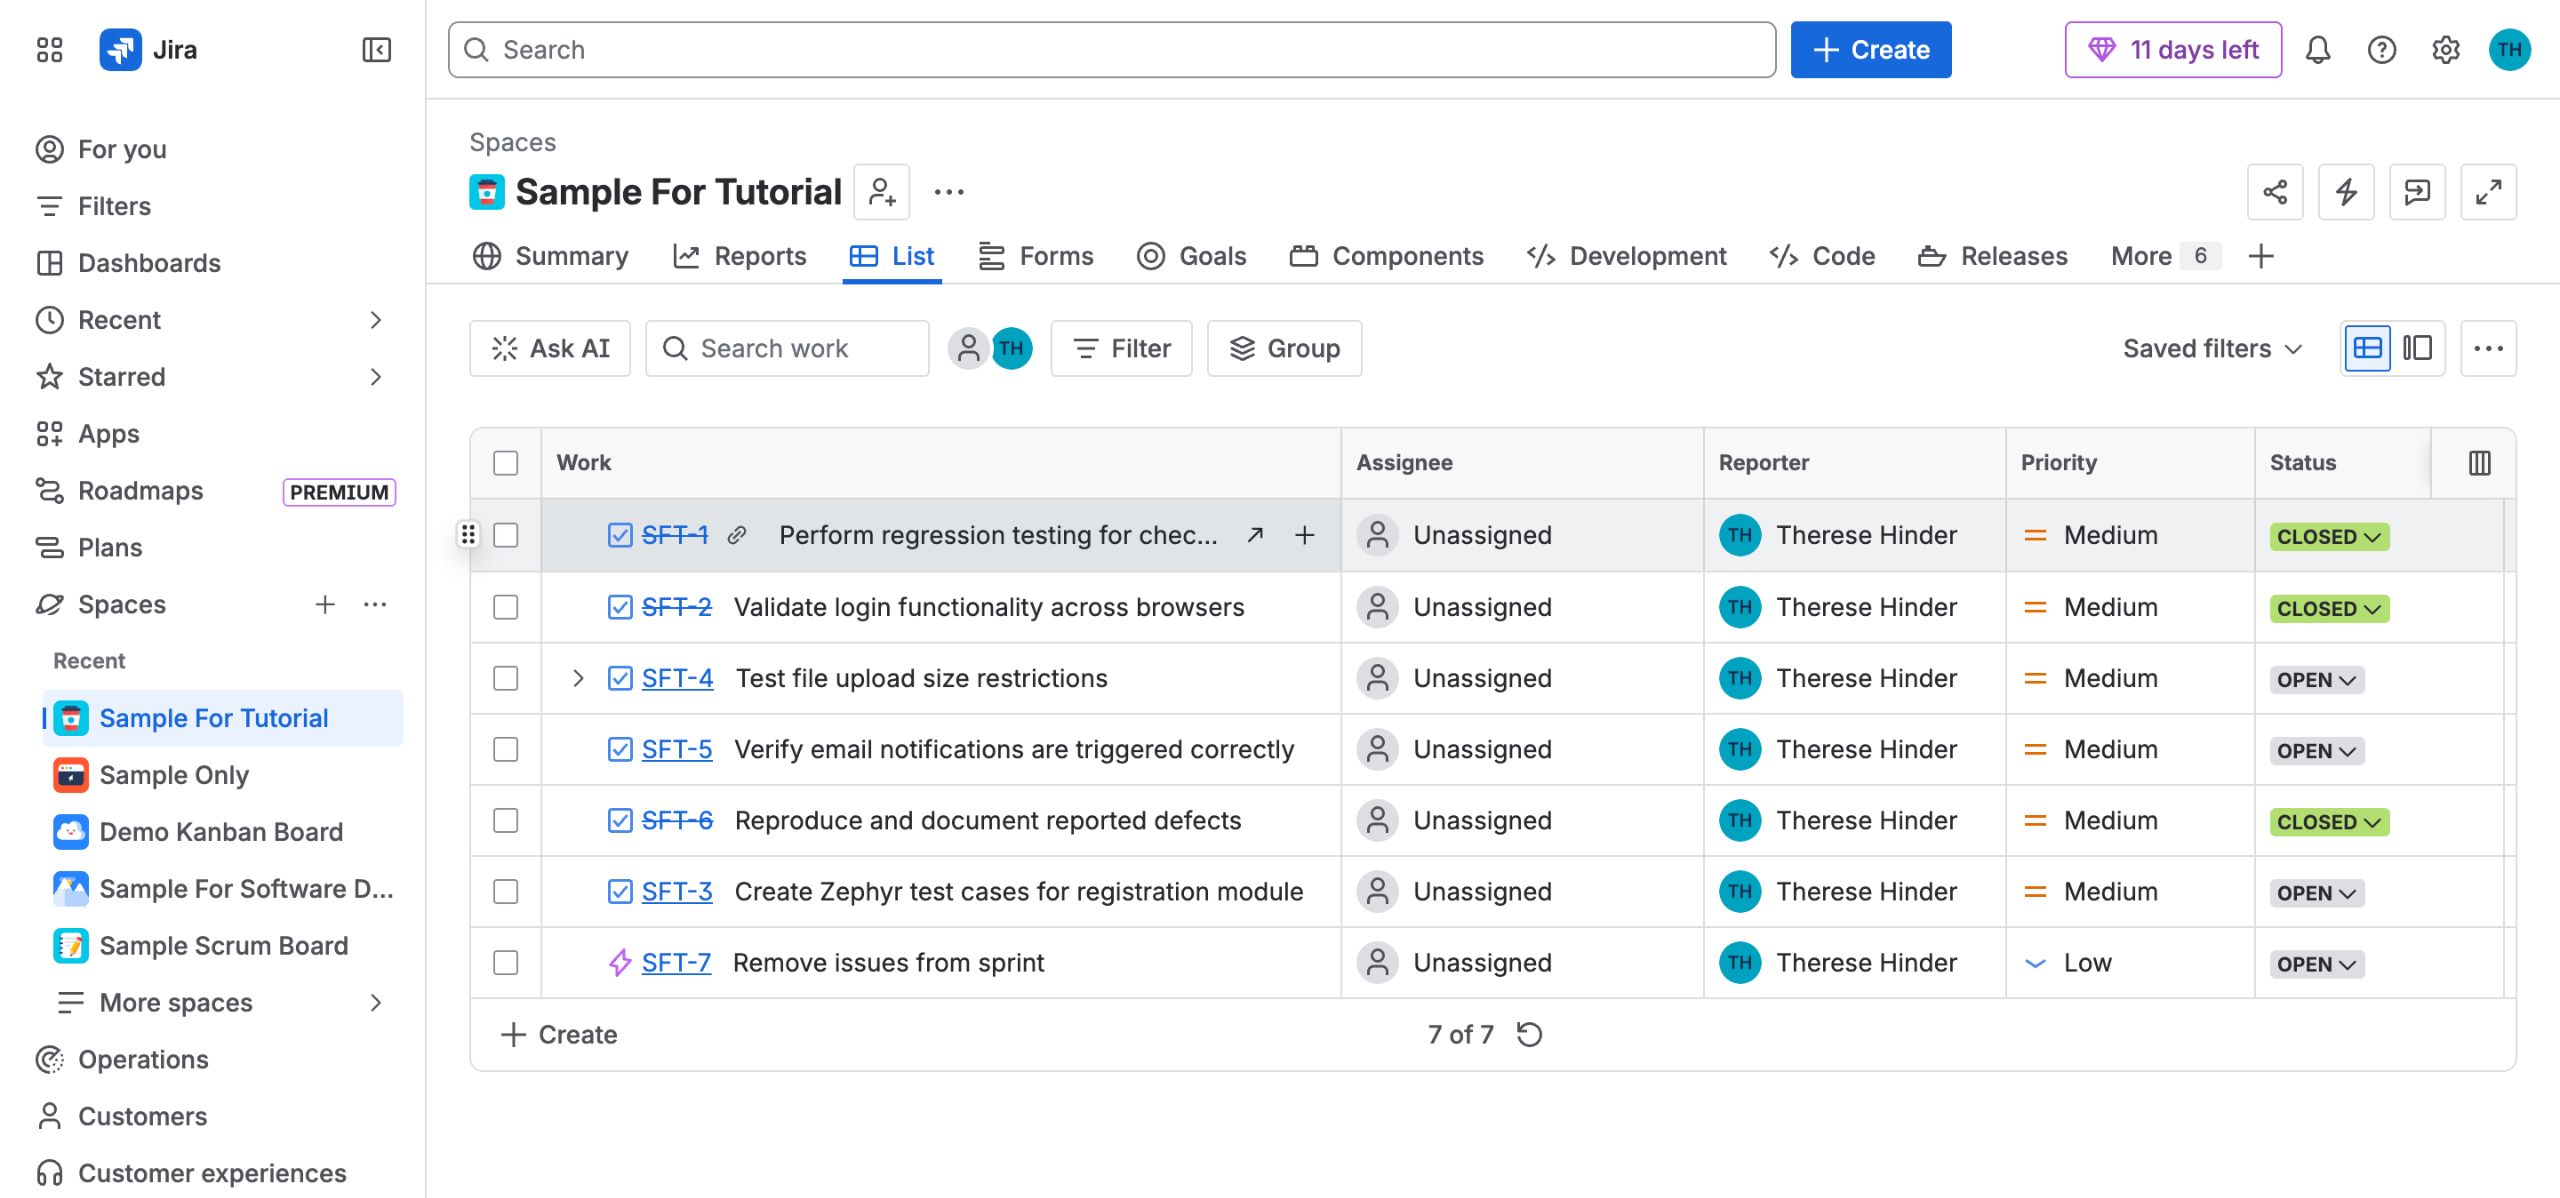
  1. Open the Jira project associated with the sprints you want to analyze.
  2. In the left-hand sidebar, click on Reports.
  3. From the list of available reports, select the Velocity Chart.
  4. Review the chart, which displays two bars per sprint showing committed and completed story points.
  5. Select a specific sprint you want to calculate using the Velocity Chart.
  6. Use the chart's visual overview to compare velocity across multiple sprints.

📌 Why this matters

Tracking sprint velocity is essential for agile teams that want to forecast capacity and improve planning accuracy over time. Jira's built-in Velocity Chart gives Scrum teams a clear, visual breakdown of committed versus completed story points for every sprint, making it easy to spot trends and inconsistencies. By understanding sprint velocity, teams can set more realistic sprint goals, reduce overcommitment, and deliver more predictably. This feature is a core part of agile reporting in Jira and is critical for any team practicing Scrum at scale.
Your product deserves an interactive demo
Start free
Similar Articles
Jira

How to Use Jira for Project Planning

Madhav Bhandari
Director of Marketing @ Storylane
Jira

How to Create Recurring Tasks in Jira

Madhav Bhandari
Director of Marketing @ Storylane
Jira

How to Write Test Cases in Jira

Madhav Bhandari
Director of Marketing @ Storylane
No items found.
Platform
Demos
RepX
Hubs
Integrations
Solutions
Marketing
Sales
Features
Demo Signals
Personalization
Deal Intelligence
Resources
Blog
Tutorials
Help Docs
What’s New
Demo Dundies
Customers
Demo Showcase
Customer Stories
Finer Demos Club
Company
Careers
Pricing
Partners
Contact
Trust Center
Backed by
Chrome Extension Icon
Chrome extension
Download
Desktop app
Download
Built in San Francisco Bay Area - ©2026 Storylane
Privacy PolicyTerms & Conditions
X Corp (formerly Twitter)LinkedIn
This website uses cookies to ensure you get the best experience on our website. Learn More
Got it
This website uses cookies to ensure you get the best experience on our website. Learn More
Got it