Quick summary
The Jira Control Chart lets you calculate lead time by visualizing how long each issue takes to move through your workflow. Navigate to the Reports section of your project to access average lead time data instantly.
Steps
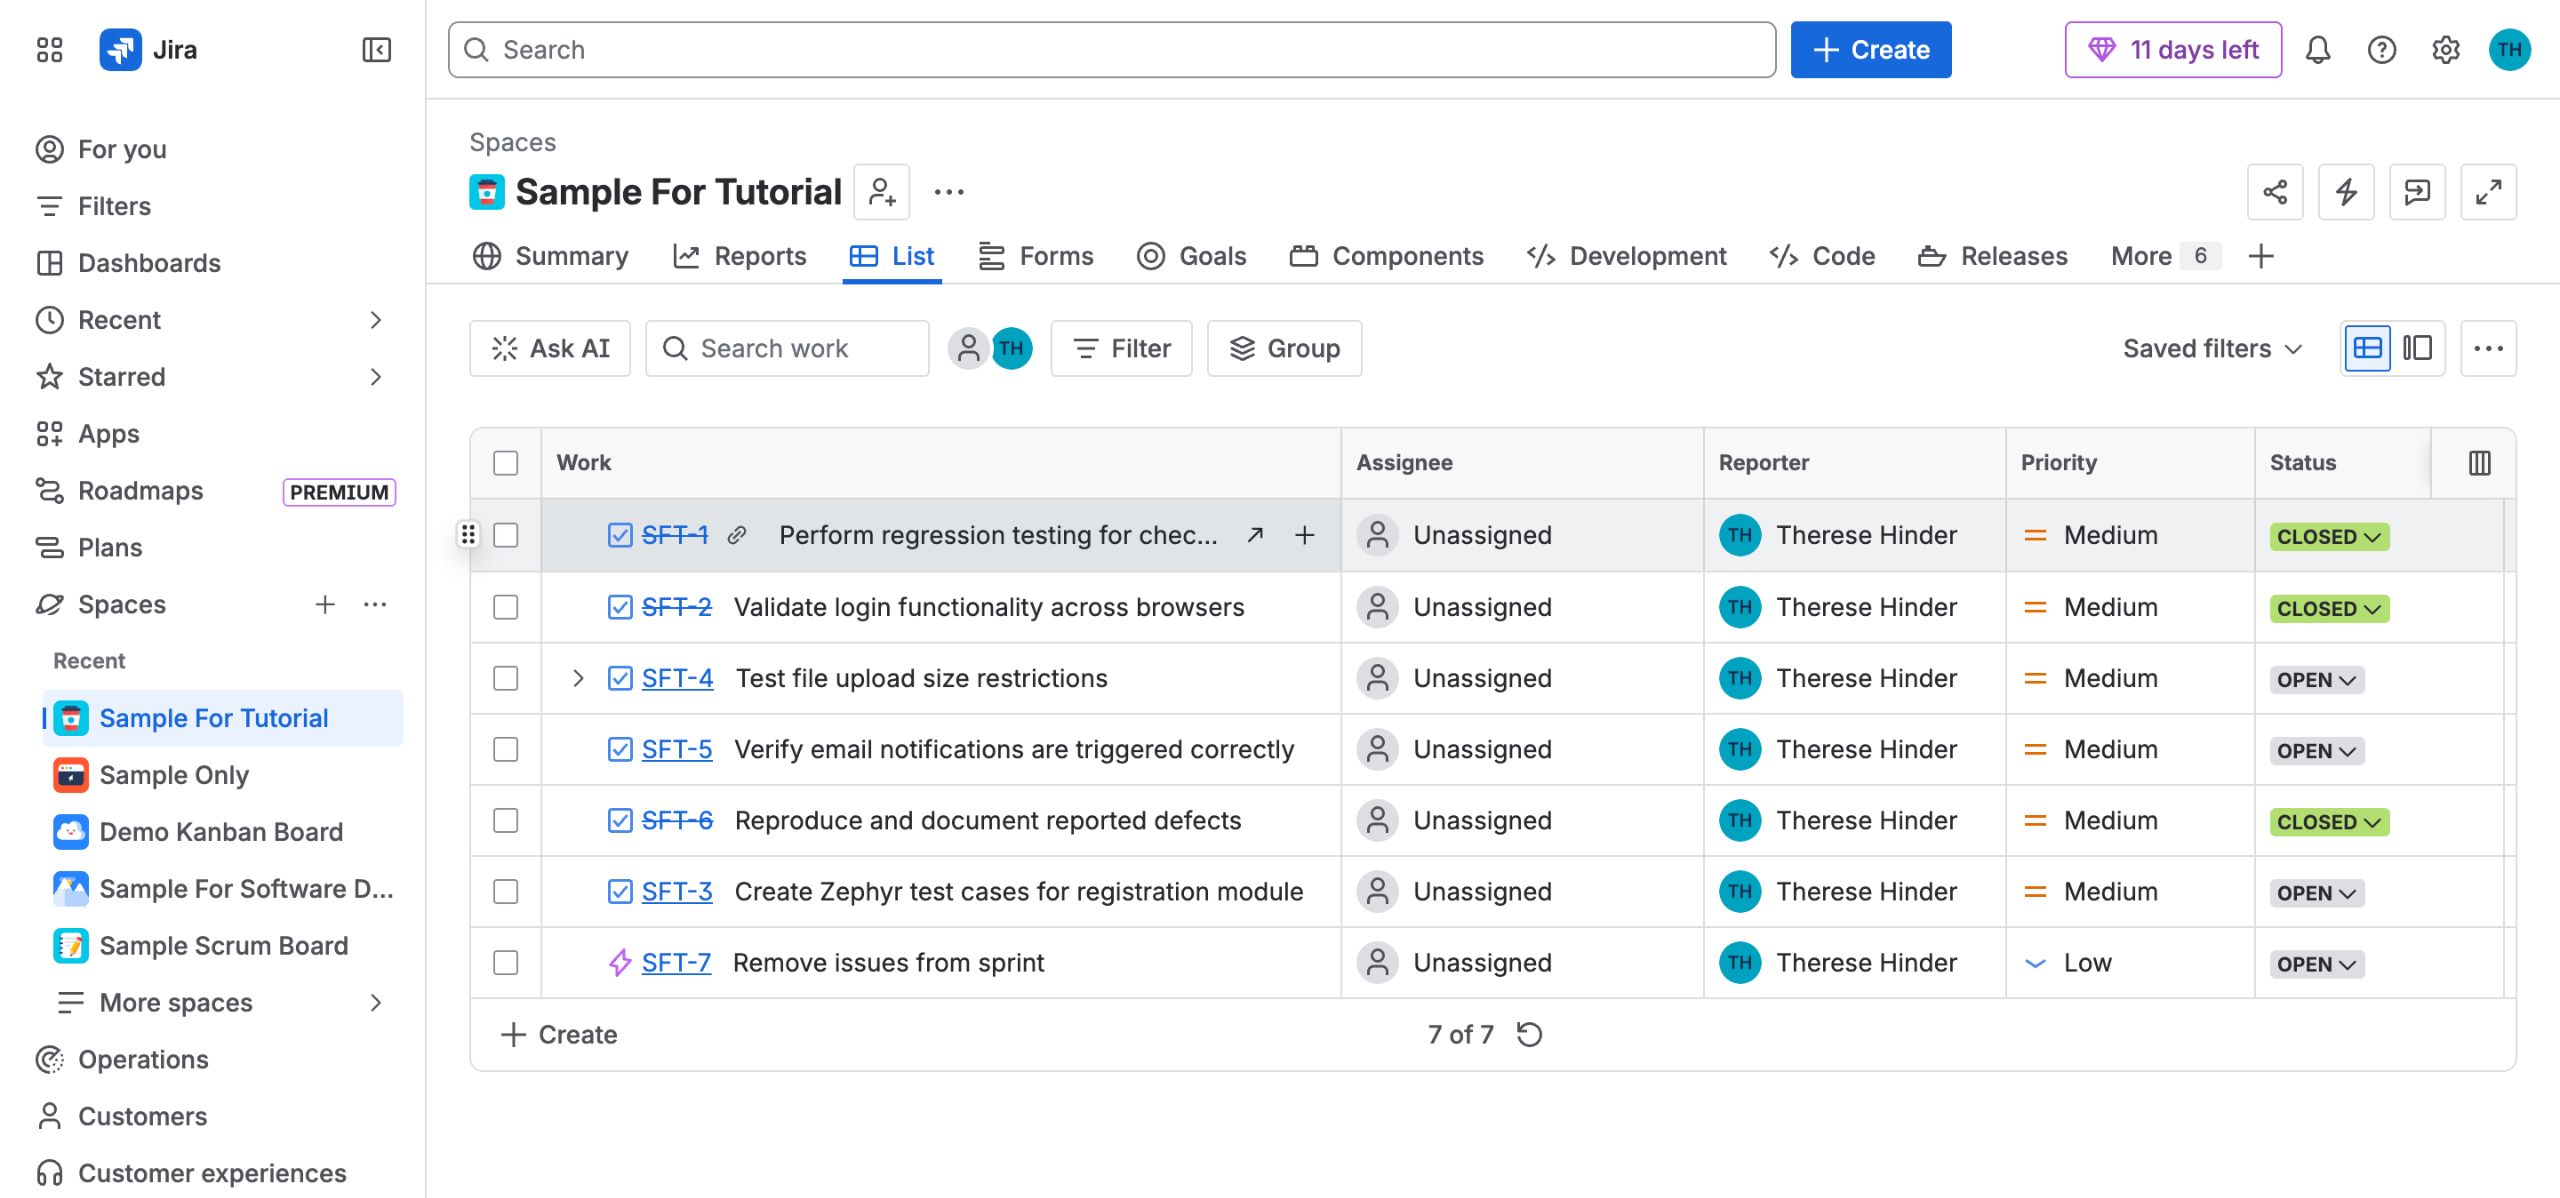
- Navigate to your Jira project to get started.
- Go to Reports in the left-hand menu.
- Select Control Chart from the list of available reports.
- Review the Control Chart to see the average lead time and a visual breakdown of how long each issue took to move through your workflow.