Here’s how to do it:
- Upload your data into the report.
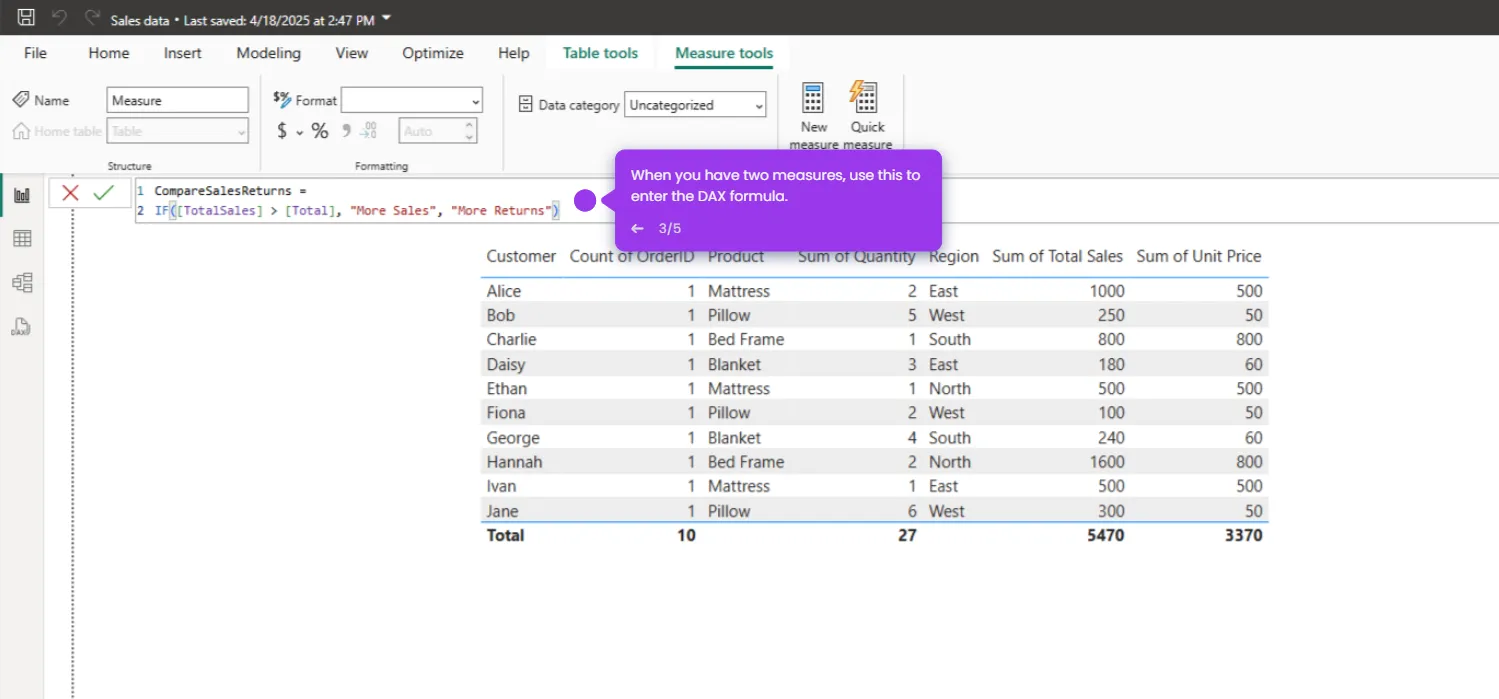
- Select a visual to filter context row by row and column by column.
- If you put a visual on a report page, the measure inside the visual will automatically calculate within that filter context.

.svg)
.svg)


