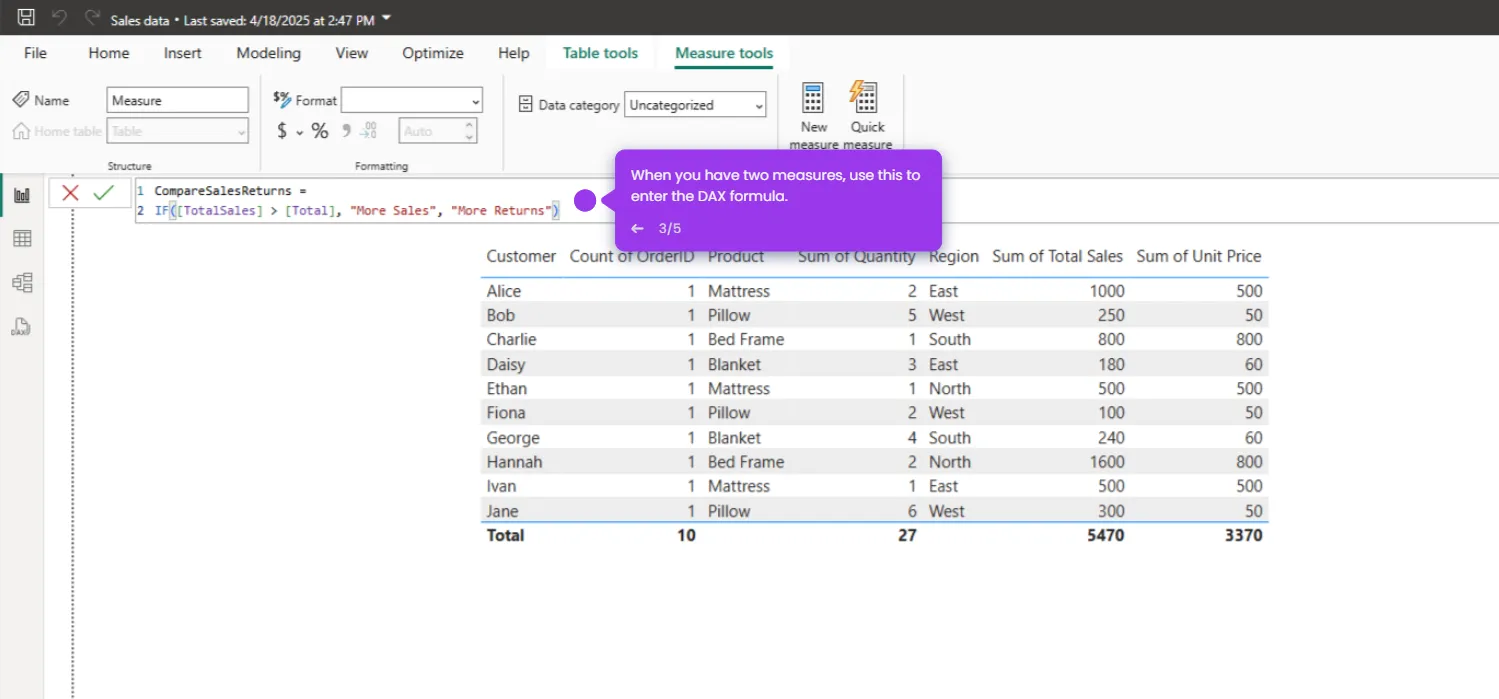
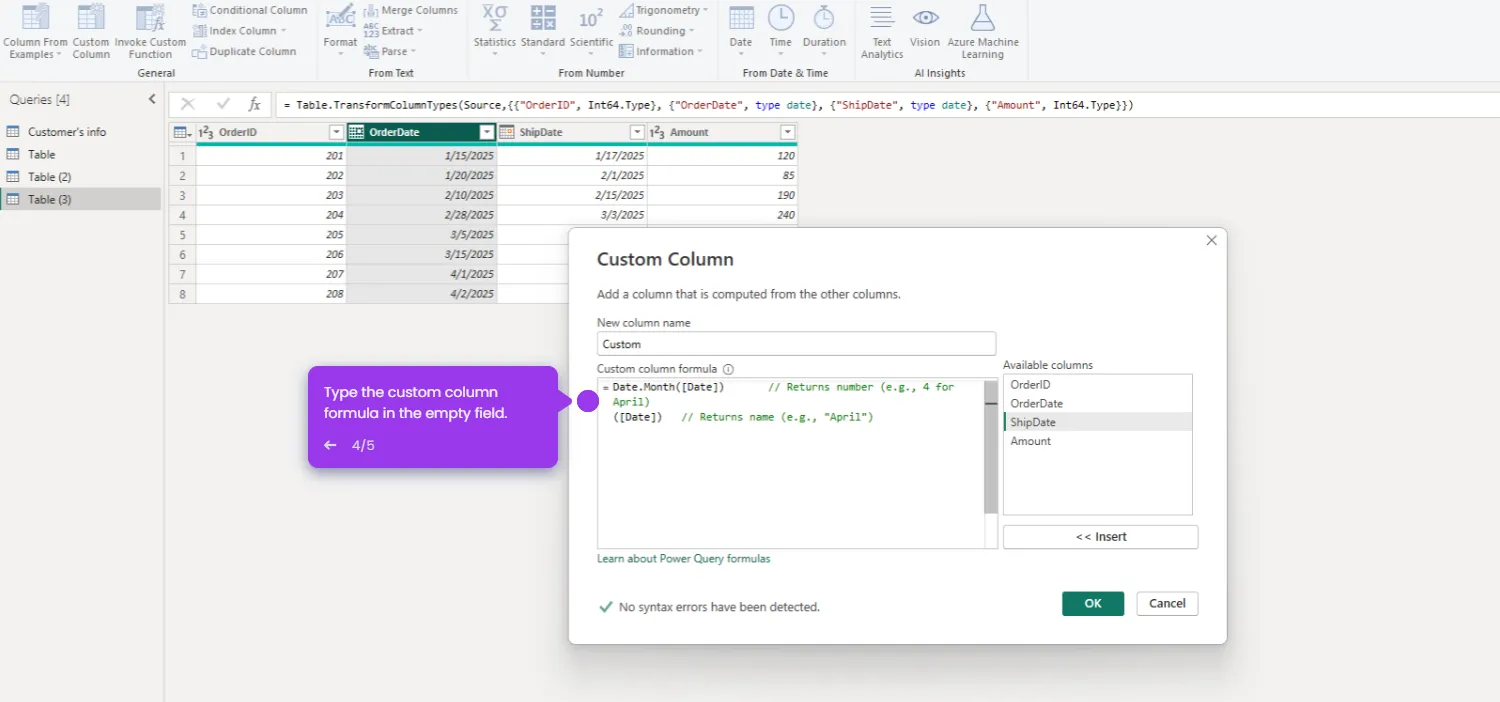
Here’s how to do it:
- Launch Power BI Desktop and click on the 'Blank report'.
- Make sure your dataset is already loaded.
- Navigate to the 'Visualizations' pane.
- Select your visual to visualize your data.
- Go to the 'Data' pane.
- Drag fields from your data model to the report canvas to create visualizations.
- With these steps, you should be able to add visuals to your Power BI data.

.svg)
.svg)


