This interactive demo was created free with Storylane in 2 minutes. Create your own demo
Start free
All Tutorials /Qlik

How to Add Filters in Qlik Sense

Updated on:
June 5, 2026
By:
Madhav Bhandari
Use this tutorial to learn how to add filter panes to control the data shown in your Qlik Sense visualizations.

‍

This tutorial shows how to create filter panes on a sheet so you can limit data across multiple dimensions at once, such as filtering by time period, product category, and region simultaneously. 

Notes:

  • You need an app with data and visualizations already created to add filters effectively.
  • A filter pane can contain up to 1,000 dimensions, and each dimension added is placed to the right of or below the previous one depending on available space.
  • Filter selections are reflected in all visualizations on the sheet - when you select a value in a filter pane, the charts and tables update automatically to show only matching data.
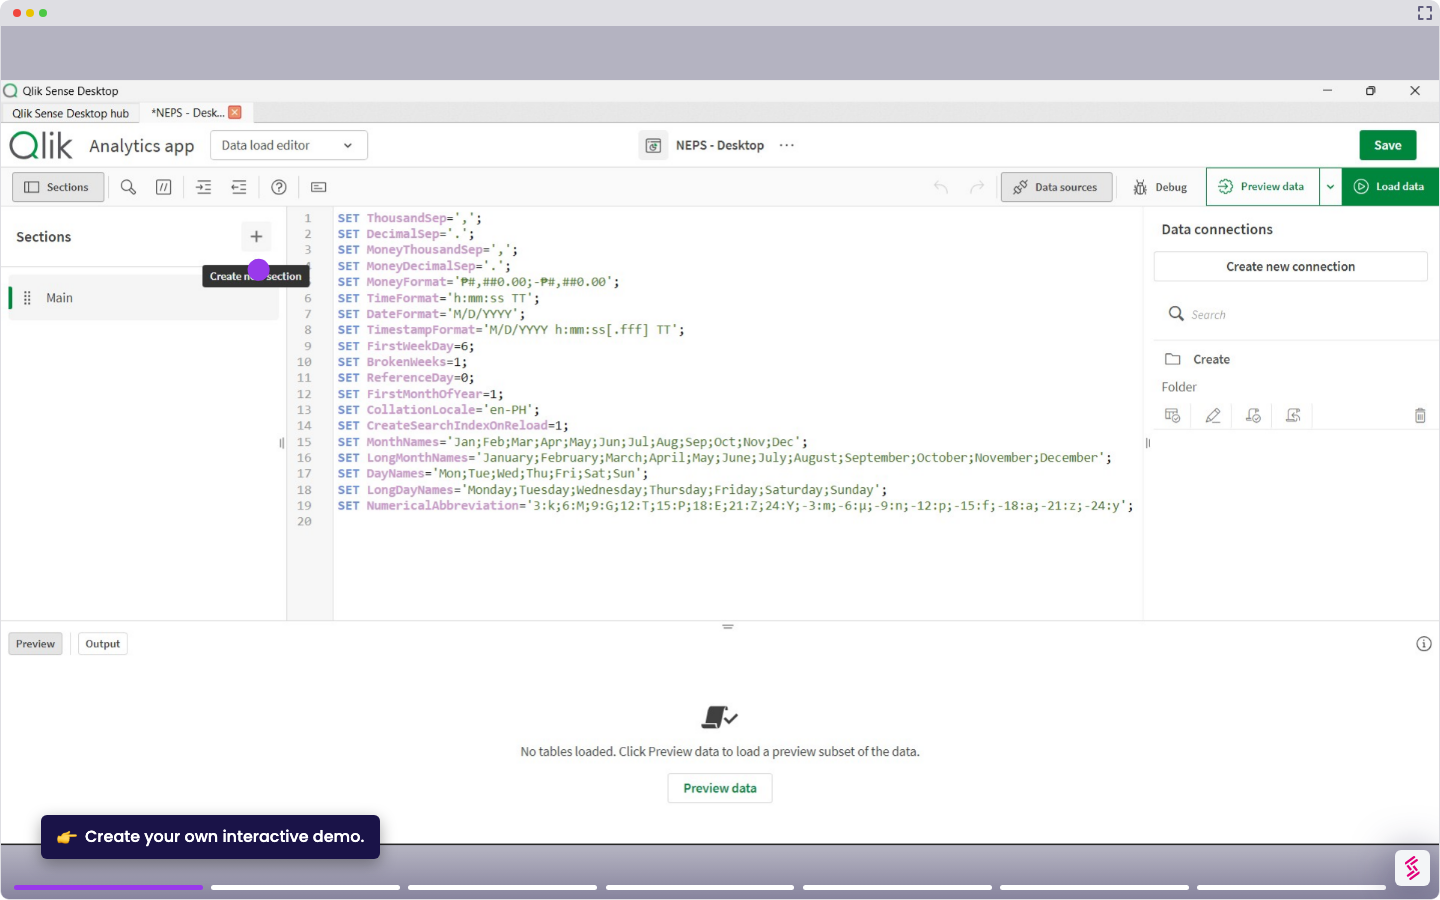
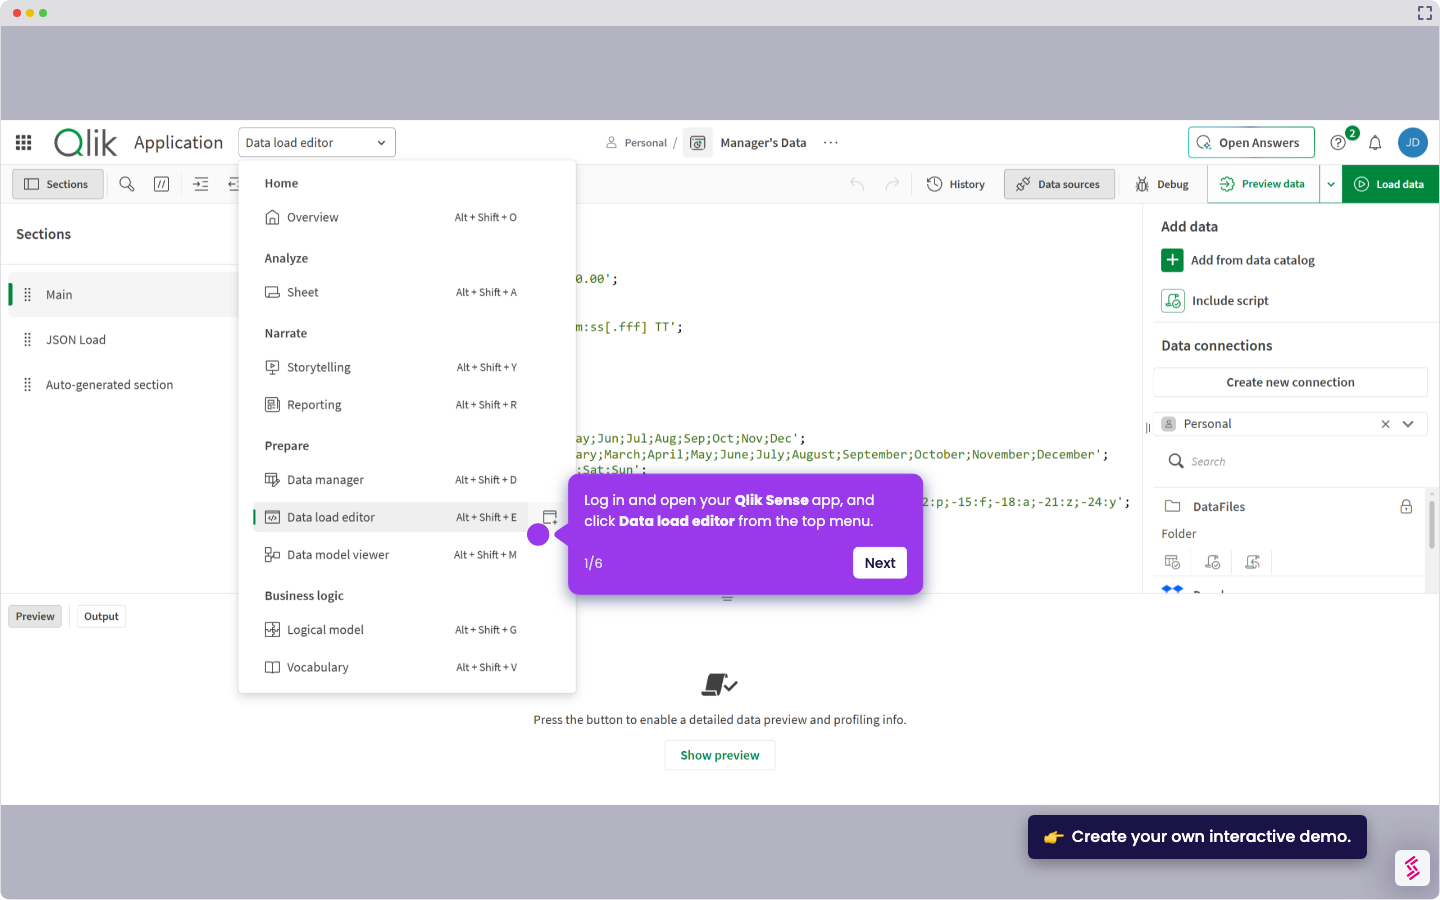
  1. Login and open your Qlik Sense app and go to the sheet where you want to add filters, click Edit sheet to enter edit mode.
  2. In the Assets panel on the left, click Charts then find and drag an empty Filter pane object onto the sheet canvas.
  3. Click Add dimension on the Filter pane to open the dimension selection dialog.
  4. Select a field or dimension from your data (for example, Name, Category, or Brand) and click it to add it to the Filter pane.
    Note: To add more filter dimensions, click Add dimension again and repeat step 5 as needed (you can add up to 1,000 dimensions).
  5. When finished adding dimensions, click Edit sheet again to exit edit mode and activate the filters.
  6. Use the filter pane during analysis by clicking values to refine your selection. The colors indicate the following:
    • Green: Selected values
    • White: Possible values
    • Light gray: Alternative values‍
  7. Dark gray: Excluded values

📌 Why this matters

Filter panes are essential for exploring data interactively in Qlik Sense. Instead of creating separate dashboards for each analysis scenario, one filter pane lets you control multiple dimensions simultaneously, making it easy to drill down from broad views to specific insights. The visual feedback (colored bars showing selection states) helps you understand which values are selected, possible, or excluded, reducing confusion during analysis. Well-designed filter panes transform static dashboards into dynamic exploratory tools that let users answer their own questions without developer intervention.

Your product deserves an interactive demo
Start free
Similar Articles
Qlik

How to Create a QVD File in Qlik Sense

Madhav Bhandari
Director of Marketing @ Storylane
Qlik

How to Restart Qlik Sense Services

Madhav Bhandari
Director of Marketing @ Storylane
Qlik

How to Integrate Qlik with Airbyte

Madhav Bhandari
Director of Marketing @ Storylane
No items found.
Platform
Interactive Demos
Sandbox Demos
Hubs
RepX
Integrations
Solutions
Product Marketers
Growth & Demand Gen
Sales Reps & AEs
Presales & SEs
Customer Success
Product Managers
Customers
Demo Showcase
Customer Stories
Finer Demos Club
Features
Demo Signals
Personalization
Deal Intelligence
Resources
Blog
The Plot
Tutorials
Help Docs
What’s New
Demo Dundies
Company
Careers
Pricing
Partners
Contact
Trust Center
Backed by
Chrome Extension Icon
Chrome extension
Download
Desktop app
Download
Built in San Francisco Bay Area - ©2026 Storylane
Privacy PolicyTerms & Conditions
X Corp (formerly Twitter)LinkedIn
This website uses cookies to ensure you get the best experience on our website. Learn More
Got it
This website uses cookies to ensure you get the best experience on our website. Learn More
Got it