To add a report in Power BI, follow these steps:
- Launch the application on your computer. Go to the 'Home' tab and select 'Get Data'.
- Select a data source for your report.
- After connecting, you will see a preview of your data. Select 'Load' to import the data directly.
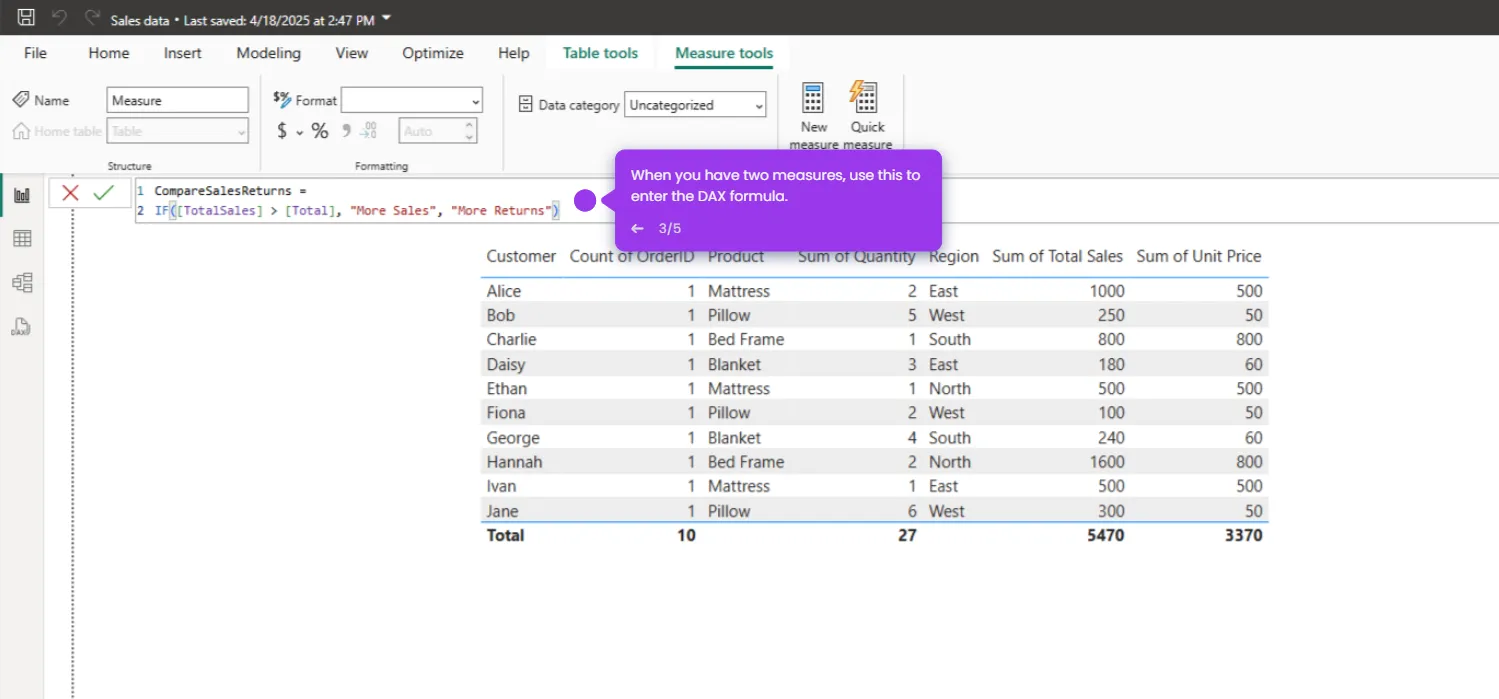
- Go to the report view indicated by a chart icon on the left sidebar.
- Select visualizations from the 'Visualizations' pane.
- Drag and drop fields from the 'Data' pane to build charts, graphs, and tables.

.svg)
.svg)


