.svg)
How PDQ proved a 92% conversion lift from their Storylane demo


Most marketers who invest in interactive demos know they're working. Proving it to leadership is another story entirely.
Allison Julander, Senior Product Marketing Manager at PDQ, knows this challenge well. As the sole owner of Storylane at her organization, she had full accountability for demonstrating the tool's value — in a way that was fair, attributable, and defensible enough that her leaders could actually trust it.
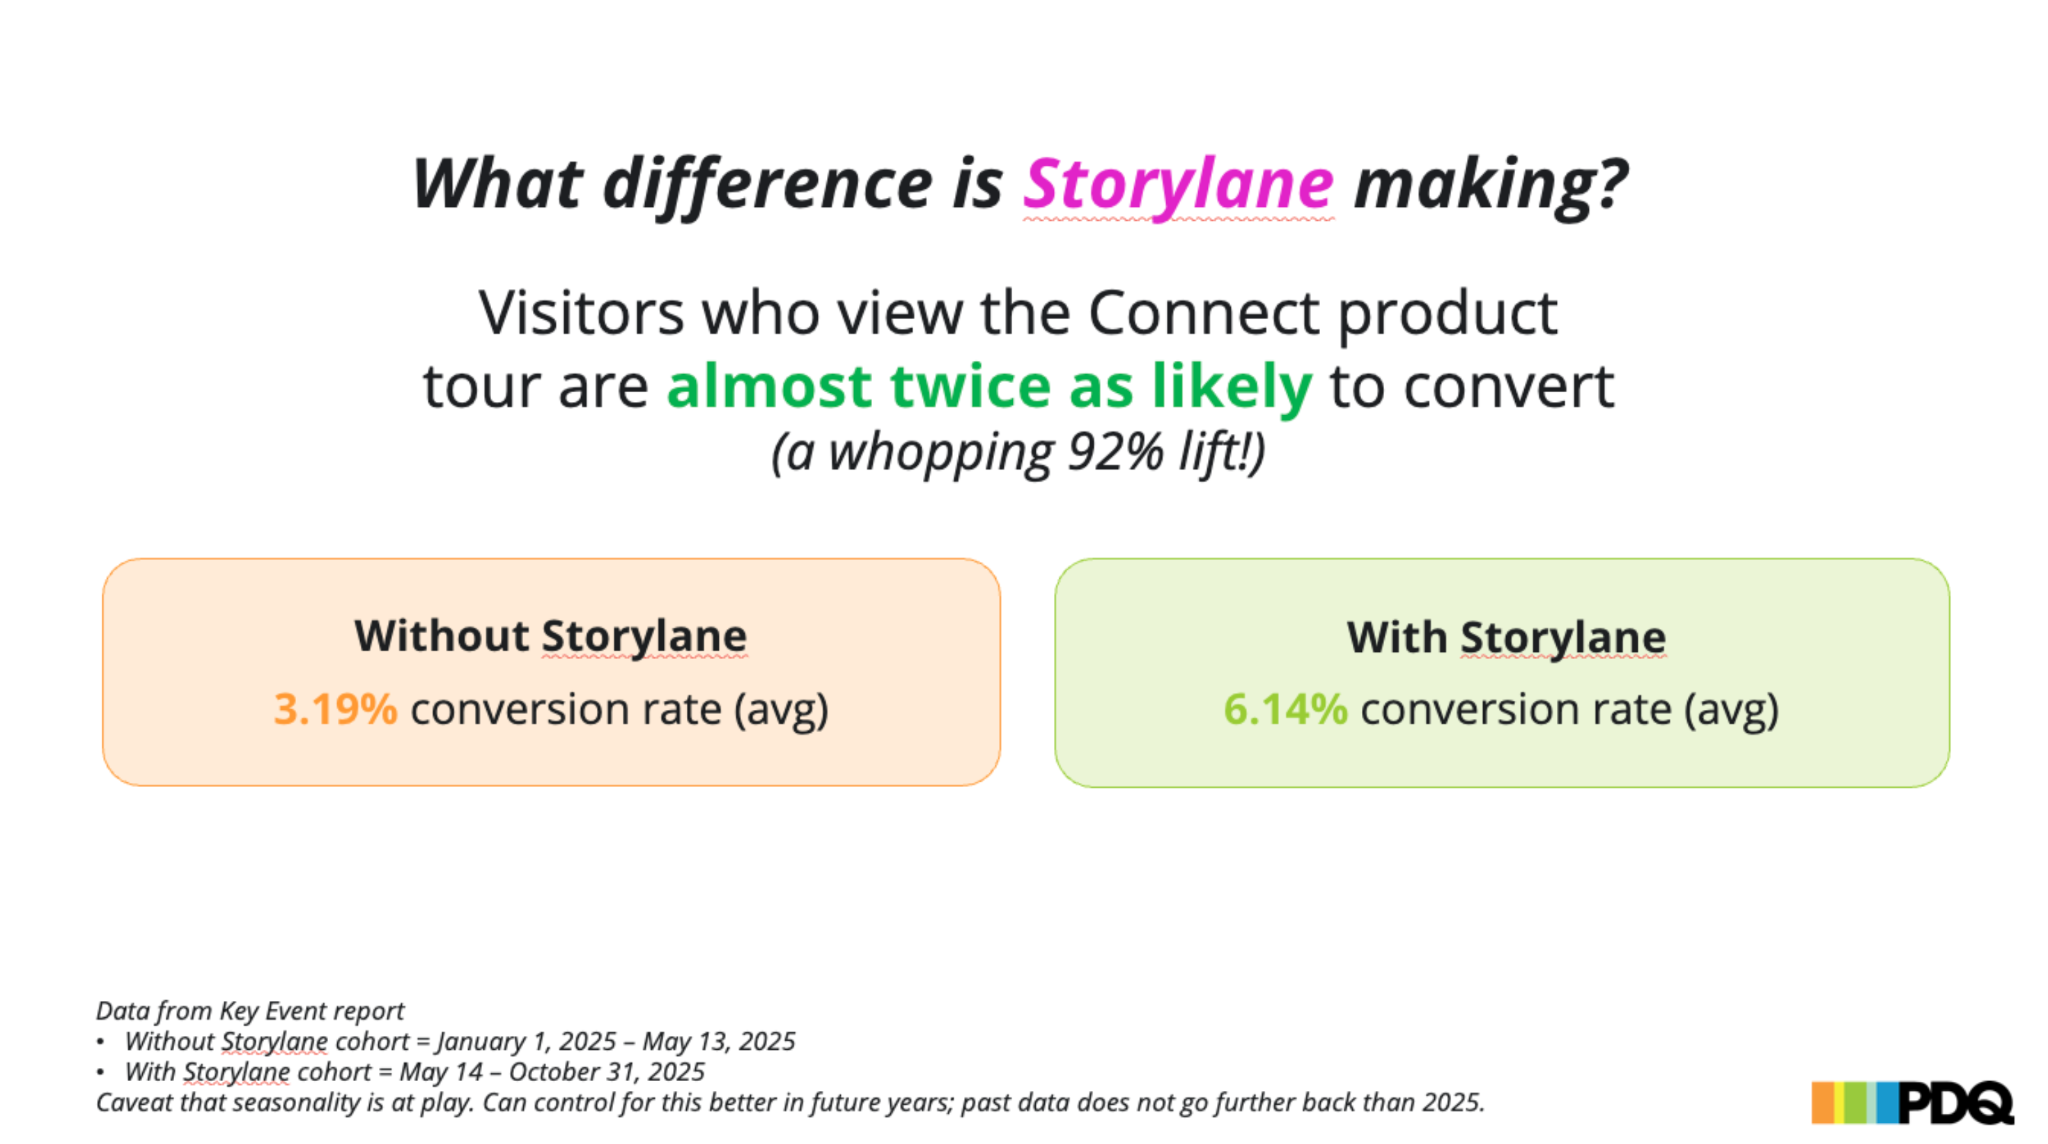
A few months in, she had her answer: visitors who view PDQ's interactive demo are almost twice as likely to convert. A 92% lift, to be exact. Here's how she got there.
.svg)
A little context on PDQ
PDQ builds endpoint management software for IT professionals — a technical, skeptical audience that wants to see products for themselves before making any decisions. Buyers can sign up for a trial, schedule a demo with an AE, or purchase directly from the website without ever talking to a sales rep.
That context matters, because it shaped everything about how Allison approached measuring ROI. With no SDR gatekeeping the funnel, the interactive demo wasn't a sales tool or a late-stage deal closer; It was a pre-trial education asset — designed to help a technical buyer understand PDQ's value proposition before they ever raised their hand.
Asking the right question
The question kept coming back to was the most obvious one: Are people who view the demo more likely to convert? Instead of trying to capture every possible signal, Allison built her reporting around the metrics she could fully stand behind — ones she could explain in a single sentence and defend if the numbers moved in either direction.
The methodology
Allison pulls data from three sources each month: Storylane analytics, website conversion data for the page the demo lives on, and Salesforce to track purchases from contacts who previously viewed the tour.
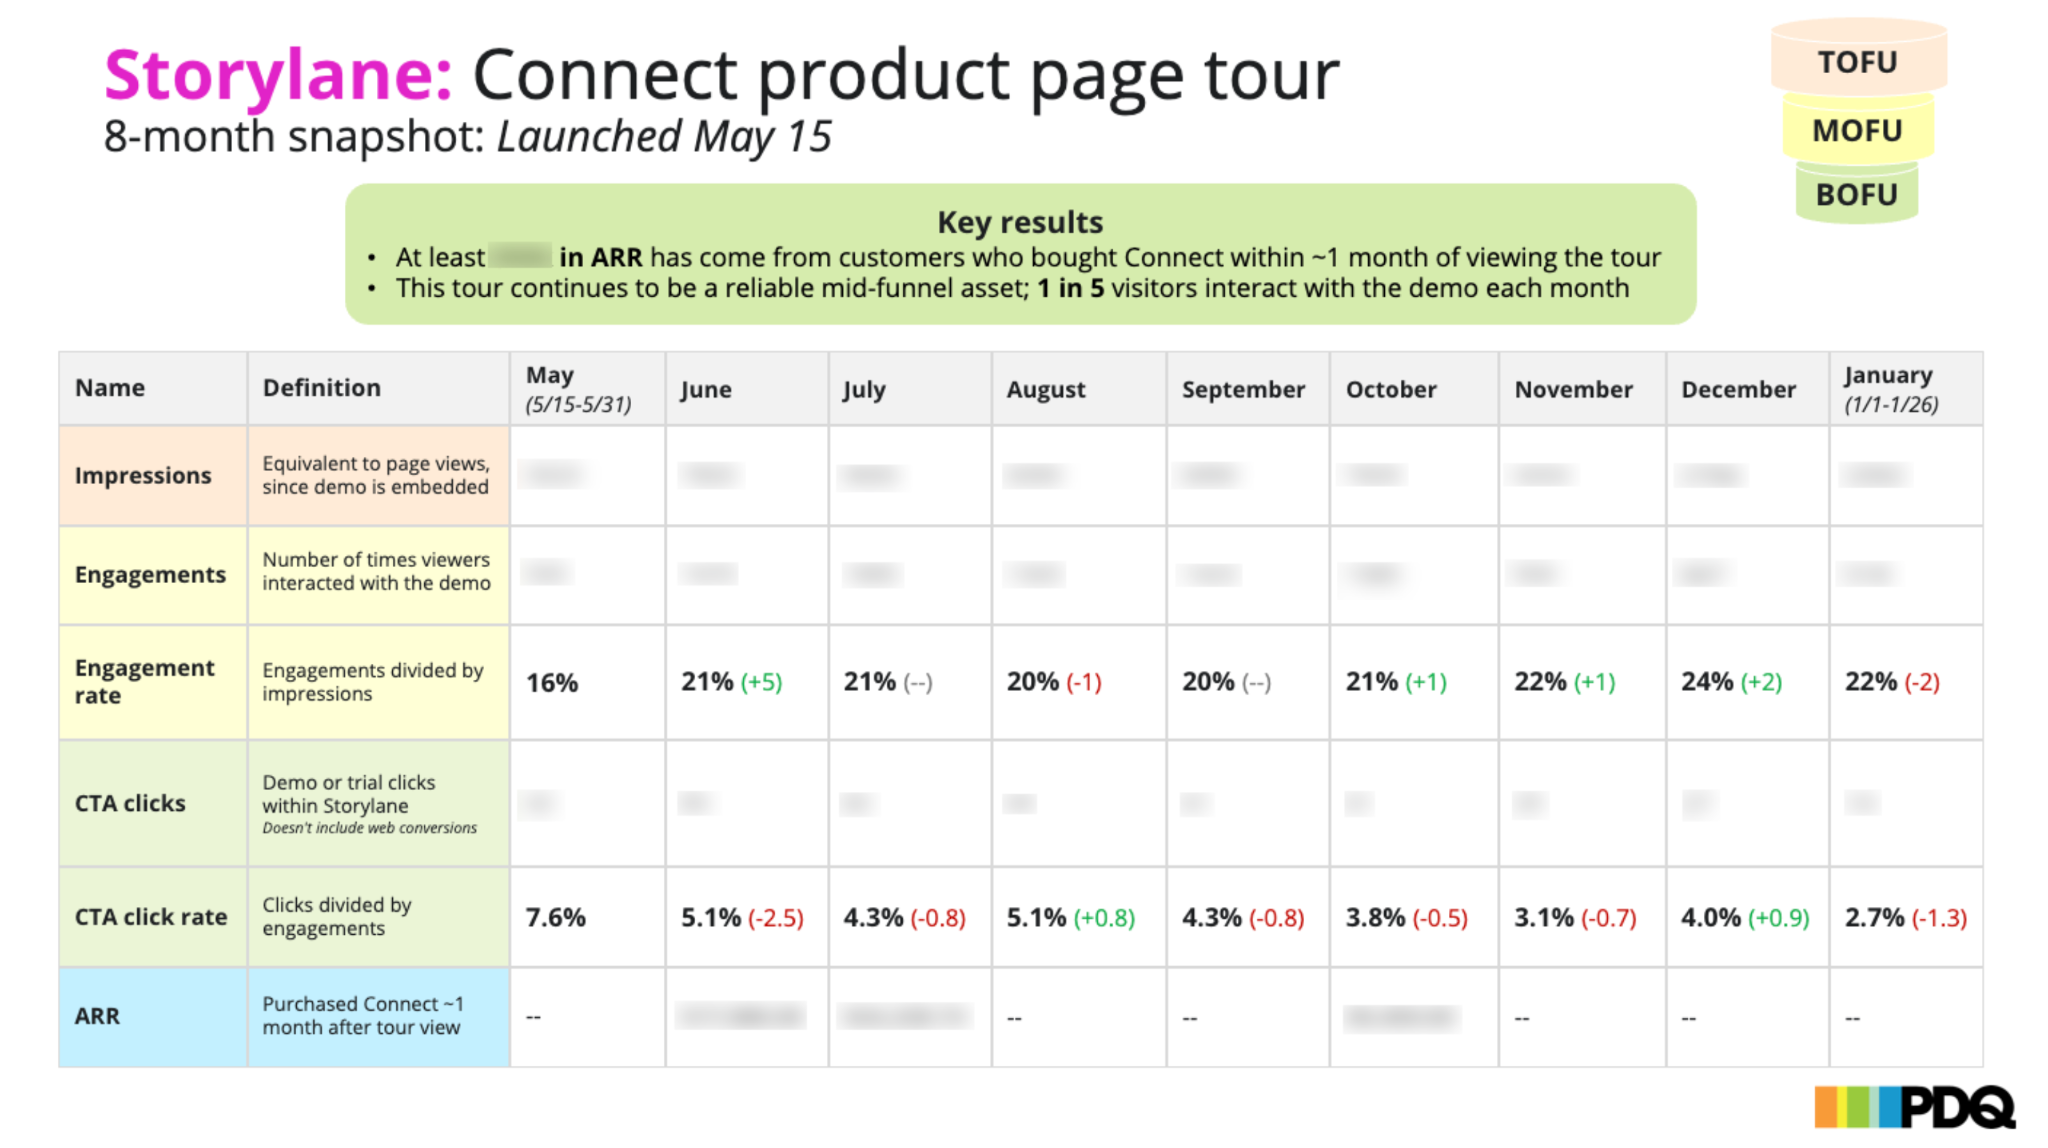
Her reporting asset is a slide deck she updates monthly, structured around funnel stages — TOFU, MOFU, BOFU — and color-coded accordingly. Every metric includes a plain-language definition on the slide itself. Not because her leaders don't understand the tools, but because clarity prevents misinterpretation, especially when the deck gets forwarded to people who weren't in the room.
The core of the report is a before-and-after cohort analysis: site-wide conversion rate before the demo launched versus after. Clean, visual, and leadership-friendly. No spiraling into weekly traffic fluctuations or seasonal noise — just a clear picture of whether the demo is moving the needle.
She also tracks a standard set of in-demo metrics month over month: impressions, engagements, engagement rate, CTA clicks, CTA click rate, and influenced ARR from customers who purchased within roughly a month of viewing the tour.
The result
- Without Storylane: 3.19% average conversion rate
- With Storylane: 6.14% average conversion rate
- Lift: 92%
Visitors who view the Connect product tour are almost twice as likely to convert. And that performance has been consistent — not a one-month spike, but a reliable signal across eight months of data.
On top of that, 1 in 5 visitors engages with the demo each month, making it one of PDQ's most dependable mid-funnel assets.
Allison also ran an A/B test on a paid landing page, pitting the Storylane demo against a video in the same placement. The demo version won — reinforcing that interactive beats passive for a technical audience that wants to explore on their own terms.