


Heading 1
Heading 2
Heading 3
Heading 4
Heading 5
Heading 6
Lorem ipsum dolor sit amet, consectetur adipiscing elit, sed do eiusmod tempor incididunt ut labore et dolore magna aliqua. Ut enim ad minim veniam, quis nostrud exercitation ullamco laboris nisi ut aliquip ex ea commodo consequat. Duis aute irure dolor in reprehenderit in voluptate velit esse cillum dolore eu fugiat nulla pariatur.
Block quote
Ordered list
- Item 1
- Item 2
- Item 3
Unordered list
- Item A
- Item B
- Item C
Bold text
Emphasis
Superscript
Subscript

SaaS businesses thrive on data-driven marketing.
SaaS marketing metrics are a working assembly of marketing strategies that use data to make decisions. They’re vital to a business’ overall health. However, when you set foot on finding the most suitable ones, chances are you’ll stumble upon many.
Avoid confusion and the need to track everything; instead, here’s a list of twelve SaaS marketing metrics that can inform your marketing strategy and set it up for success.
What Are SaaS Marketing Metrics?
Software-as-a-service (SaaS) marketing metrics provide a numerical representation of how well your business is able to attract, engage and convert prospects through its marketing efforts. These metrics are like the milestones or signage that tells you where you are on an empty freeway.
It could be:
- Lead sign ups - tracks number of high buying-intent prospects who signed up for a lead magnet.
- The number of active trials - counts how many people are trying out your service.
- Number of free trials to paid conversion - tracks how many people move from a free trial to a paid plan.
- Lead conversion rate - measures the percentage of potential customers (leads) who buy your service.
- Lead velocity rate - tells you how quickly you get new potential customers.
So, if lead sign ups are dwindling, it raises an eyebrow. Are the existing lead magnets not on trend anymore? Do you need to prepare an updated lead magnet? Or even a totally different one solving a new problem? These SaaS marketing metrics will show you how to drive your marketing strategy.
12 SaaS Marketing Metrics You Shouldn’t Overlook
Today, we’re exposed to an unprecedented amount of data, each day unlike any other we’ve seen before; visitor data, visitor behavioral data, interaction data, and many other beautiful data points. It’s a marketer’s dream come true.
Want to know which channel to double down on? Look at which brings the highest number of qualified leads. Deciding between subject lines? A/B test them! Want to find out which topics your readers care about most? Check which content has the highest clickthrough rates or minimum bounce rate.
Marketing has always been about making data-backed decisions. And today, when data is abundant, and there’s a metric at every turn and corner, the question remains of which ones you should track?
Below is a list of SaaS marketing metrics you could track in your marketing program.
1. Number of Active Trials
Now, we know this is an obvious one. But in the process of eliminating and prioritizing, we hope you don’t brush this aside. All said and done, this is still one of the best metrics you should be tracking. For the uninitiated, It counts the number of people who use your SaaS product through a free trial. It shows how healthy your sales pipeline is, and how well your inbound lead generation or outbound prospecting works.
To learn about user behavior, you can monitor product usage through software like Amplitude or Pendo.
The Ideal Benchmark For The Number of Active Trials
- For free trials that don’t need credit card details. More than 2% of visitors take a free trial.
- For free trials that require credit card details. More than 1% of visitors take free trials.
- For free trials that need payment upfront. They provide an option to cancel within a period to get a full refund. If you’re getting more than 0.5% of visitors to take the free trial, you’re hitting the benchmarks.
Who Tracks The Number of Active Trials?
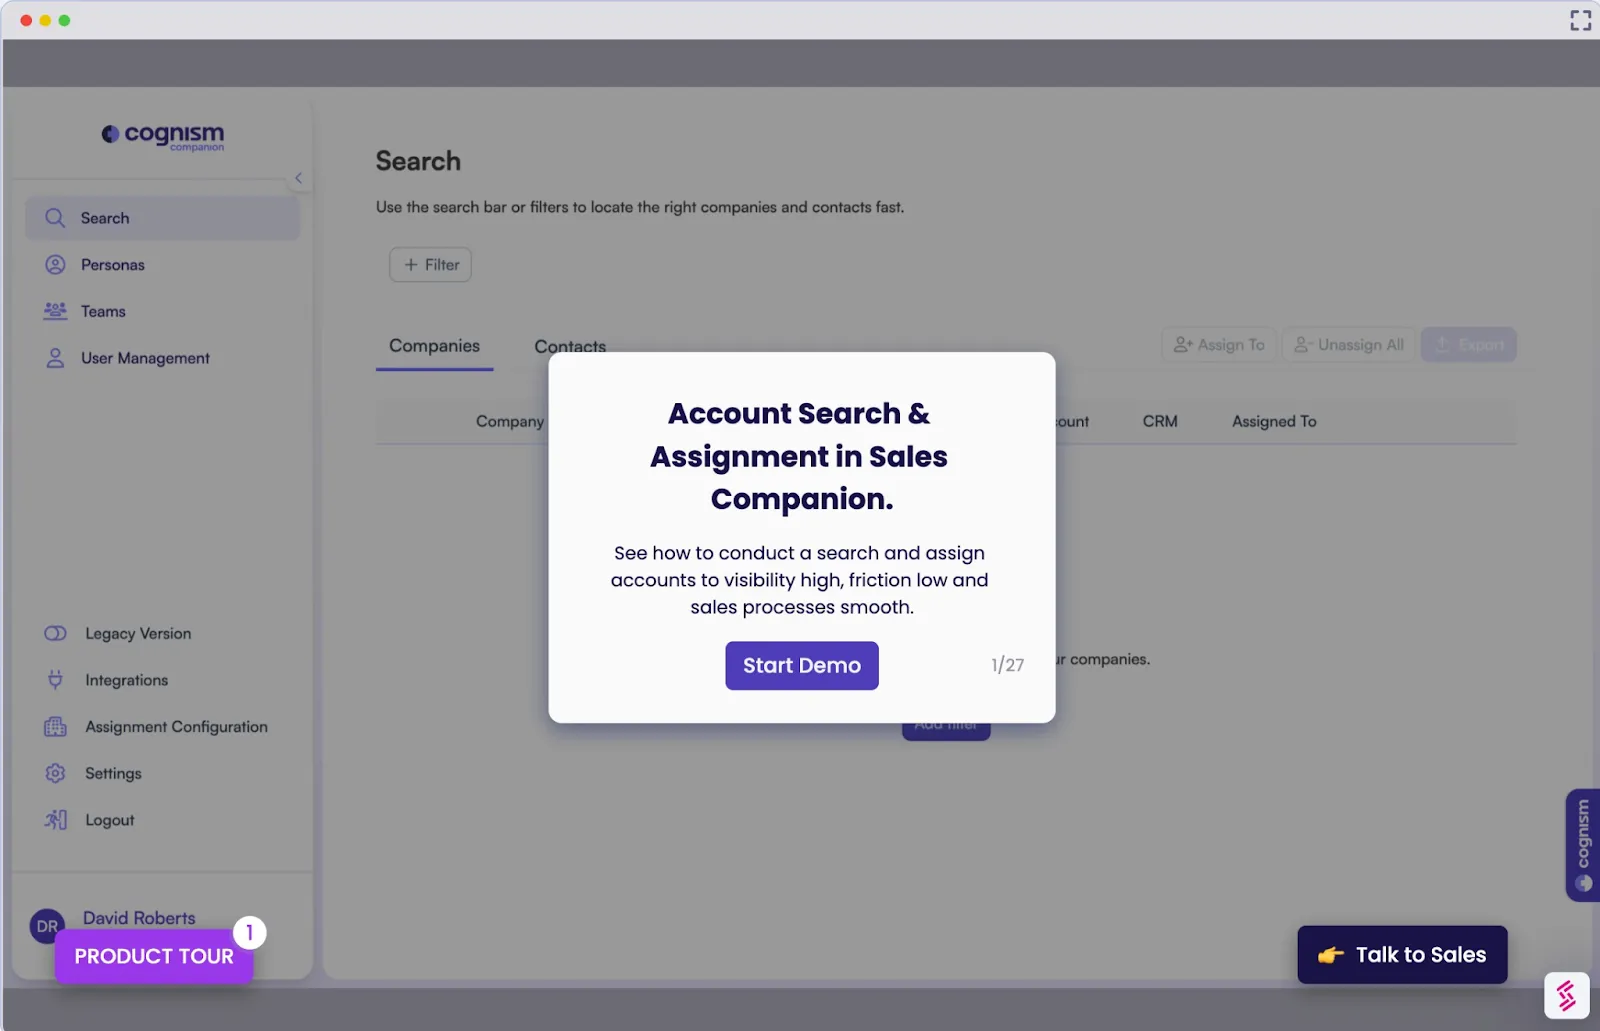
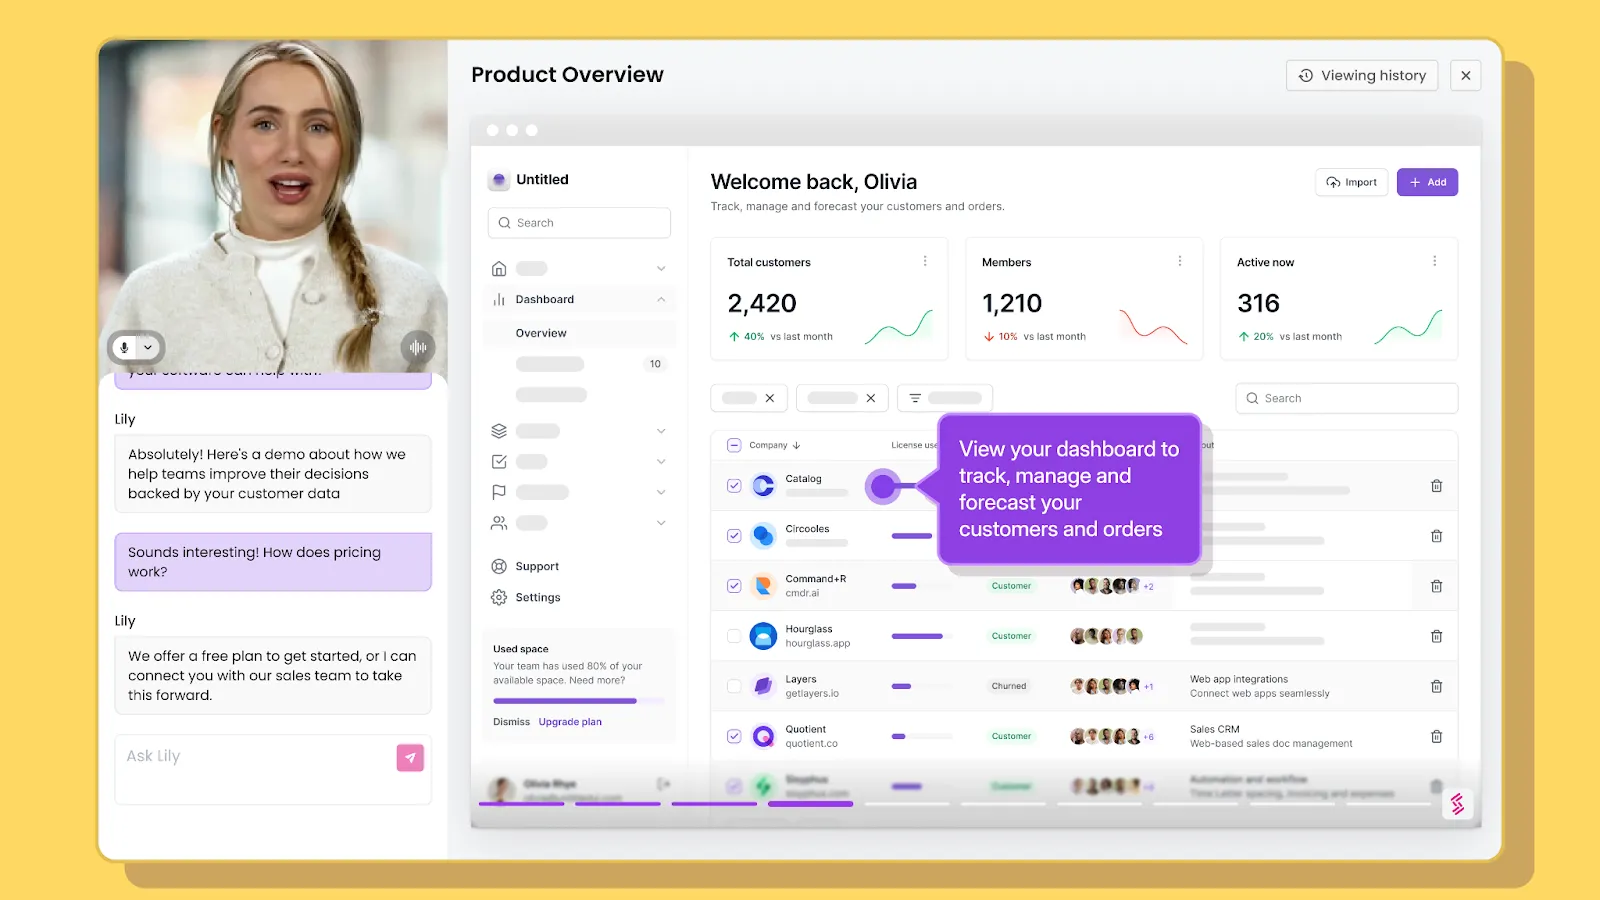
Product marketers keep a watch on active trials. They create product tours and guides to engage free trial users, helping them reach the aha moment quickly. This is when the first low-touch onboarding happens.
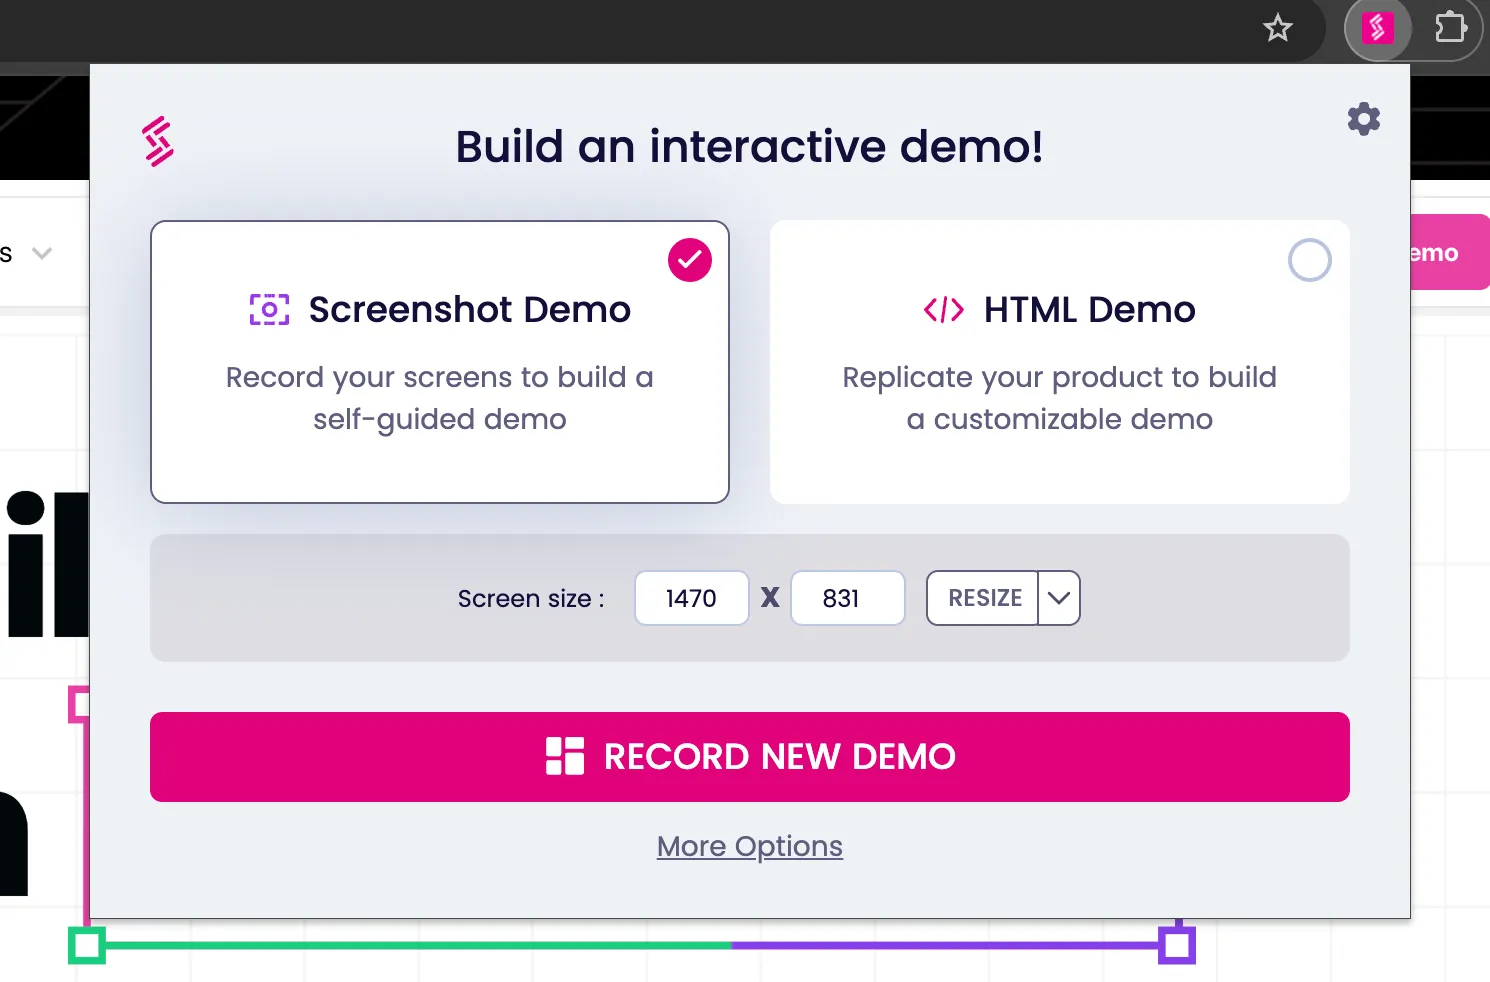
You can create interactive demos and product tours with software like Storylane. It helps new users get the most value from your product, encouraging them to consider a premium subscription plan.
2. Free Trial to Paid Conversion
The metric measures how many people switch from a free trial or product to a paid subscription. This is a crucial metric to track because it gives you insight into why people convert, why they don’t, and what top friction points are for conversion. It’s also great to collect user feedback.
Since it directly impacts revenue, tracking signups to paid conversion becomes crucial. Regardless of size, every company could religiously track free trials to paid conversions. It holds key insights like drop-offs, how quickly users reach the aha moments, how frequently they reach the aha moment, and more.
*This is relevant for businesses offering a free plan or trial.
The Ideal Benchmark For Free Trial to Paid Conversion
As per FirstPageSage, the conversion benchmarks are as follows:
- In opt-in free trials. Between 17% to 20% of users become paying subscribers.
- In opt-out free trials. Between 48% to 51% of users purchase subscriptions.
- In freemium models. Between 2% to 3% of users become paying customers.
Who Tracks Free Trial to Paid Conversions?
Product managers and product marketers keep track of this metric for companies focusing on product-led growth. On the other hand, for businesses with a set outbound sales motion, sales teams collaboratively track free trial to paid conversion.
3. Lead Conversion Rate
You can track lead conversion at different scales. If you zoom in to website metrics, you could track lead conversion on every landing page. If you zoom out to a sales perspective you could track how the rate of leads that converted to actual sales. If it’s the latter you want to track, it's referred to as lead-to-customer conversion rate by the Corporate Finance Institute.
The Ideal Benchmark For Lead-to-customer Conversion Rate
Below are industry-wise benchmarks for lead conversion rates for businesses.
Who Tracks Lead Conversion Rate?
Sales and marketing teams collaboratively own the metric of lead conversion rates.
4. Lead Velocity Rate
The lead velocity rate (LVR) measures the growth in qualified leads from one month to the next. It's about how fast your pool of potential new customers is expanding.
Unlike many other metrics, LVR is forward-looking. It gives you a real-time snapshot of your growth and sales momentum without waiting for the leads to close, which could take months. Tracking LVR is crucial for all stages of a company. However, it's especially important for startups and companies in their growth phases, where understanding sales momentum is critical for investment decision-making.
Lead velocity rate = {(Qualified leads in the current month - Qualified leads last month) x 100} ➗(Qualified leads last month)
“Lead velocity rate is real-time, not lagging, and it predicts your future revenues and growth. And it’s more important strategically than your revenue growth this month or this quarter. Hit your LVR goal every month, and you’re golden. And you’ll see the future of your business 12-18 months out, clear as can be,”
says Jason Lemkin, VC and Founder of SaaStr.
There’s no set benchmark for lead velocity rate as it varies widely from industry to industry. A higher rate is a good sign. It shows growth momentum
Who Tracks Lead Velocity Rate?
Since lead velocity rate is a pipeline metric, it’s usually measured and kept track of by the sales team.
5. Marketing-sourced revenue
Marketing-sourced revenue shows how much money is made from customers who come through marketing efforts. This could be through ads, social media, content marketing, or any other marketing activity. It helps to see if the money you spend on marketing is turning into cash for the business.
This is where a lot of misalignment happens. Sales and marketing often strike swords when it comes to attribution. The processes in which the opportunity is tracked are different for the sales and marketing sides, creating gaps in attribution. To bridge these gaps, you should make marketing a part of the complete customer journey even after they hand opportunities to sales.
Who Tracks Marketing-Sourced Revenue?
The tracking happens on multiple fronts. The marketing operations team, sales operations, finance teams, and senior leadership teams keep track of marketing-sourced revenue as it affects the company’s overall revenue figures.
6. Customer Acquisition Cost
Customer acquisition cost (CAC) tells you how much it costs on average to gain one new customer. It includes dollars spent on sales and marketing efforts divided by the number of new customers acquired.
Customer Acquisition Cost = { (Money spent on marketing and sales efforts in a time period) x 100} / (Total number of new customers in the same time period)
CAC indicates how efficient your sales and marketing efforts are in terms of costs. If CAC is too high, it could mean your marketing is too expensive or ineffective. But not always, if you’re entering a niche market and customers have just started to discover you, the CAC can be on the higher side.
If it's low, you can be on the right track, spending your marketing dollars efficiently. However, it can also mean you’re not expanding into areas with new business opportunities.
Normally, provided the context, you’ll be able to find if your CAC is reasonable or not.
The Ideal Benchmark for Customer Acquisition Cost
The benchmark for CAC varies across different industries. But in SaaS, companies often aim to recover the CAC within about 12 months of a customer's lifetime. The time in which the company recovers CAC is called the payback period.
A general rule of thumb is that the lifetime value (LTV) of a customer should be about three times the CAC for a sustainable business.
Who Tracks Customer Acquisition Cost?
The marketing team tracks CAC as their campaigns immensely affect it. The finance department also pays close attention to CAC as it impacts the company's financial health.
7. User Activation Rate
User activation measures the point at which new users first find value in your product. This "aha" moment could be when they set up their account, use a key feature for the first time, or achieve a specific goal.
Track this right from the product's launch, as it gives immediate feedback on how intuitive and valuable your product is to new users.
User Activation Rate = { (users who hit your activation milestone) / (users who completed your signup flow)} * 100
The Ideal Benchmark of User Activation
Lenny’s Newsletter suggests the average user activation rate is 36% for SaaS products. The median is 30%.
Who Tracks User Activation Rate?
Product marketers on the product side keep track of user activation rates while collaborating with customer success folks. It helps product marketers understand user behavior and refine their onboarding flow further to improve product adoption.
8. Customer Engagement Score
The customer engagement score measures how actively users interact with your product. It's often a composite score based on user actions, like logging in, using specific features, or time spent on the platform.
Decide which activities matter the most and weigh each while calculating customer engagement scores or rates. This metric helps businesses assess which features keep users returning and make necessary improvements to them.
You can calculate it with inputs like usage frequency and depth, actions, and clickstream information. Since this score depends on the company’s internal attributes and how they calculate it, it doesn’t have a standard benchmark. The score is in the range of 1 to 100.
As per Salesforce, accounts with scores between 80 and 100 will likely renew. Work on accounts with customer engagement scores between 40 and 80. Give them a call three months before renewal and pay extra attention. Use low-touch engagement through in-product messaging and email drip campaigns to nurture those with scores between 1 and 40. As soon as they come in between 40 and 80, start using high-touch engagement to nurture them.
Who Tracks Customer Engagement Scores?
Product marketers and customer success professionals track these scores to improve retention rates. Marketers tailor campaigns based on these scores, and customer success folks support users who are at the risk of churning.
9. Customer Health Score
A customer health score tells you how likely your customers will stick around. It’s like a report card that says how healthy and happy your relationship with each customer is.
You can calculate it using data points like product usage frequency, customer support interactions, satisfaction survey results, and payment history. Below is an example of Upscope’s own customer health score ranking system.

There's no one-size-fits-all benchmark for a good customer health score because it varies based on the company's products, industry, and specific customer expectations. Each company sets its standard for what a "healthy" score looks like.
Who Tracks The Customer Health Score?
Marketers and customer success teams watch this score like a hawk because it's their job to make sure customers are nurtured, successful, and satisfied. The sales team also monitors it to identify opportunities to sell more features or upgrades to happy customers.
10. Net Promoter Score
Net promoter score (NPS) measures customer loyalty. It's based on a straightforward question: "On a scale from 0 to 10, how likely are you to recommend our company/product/service to a friend or colleague?"
People who score 9-10 are called “Promoters,” those with a score of 7-8 are “Passives,” and anyone with 0-6 is considered a “Detractor.” To get your NPS, you subtract the percentage of Detractors from the percentage of Promoters.
The Ideal Benchmark of NPS in SaaS
“If your SaaS product has an NPS of above 27, you’re doing good,” says Sasmetrix’s report on NPS benchmarks.
Who Tracks NPS Score?
Both product and customer success teams keep track of NPS to recognize promoters and nurture detractors of a product. It helps them keep customers happy and fix any problems that might come up. The marketing team uses NPS to estimate brand loyalty and understand the customer's voice.
11. Customer Churn
Customer churn shows how many customers a company has lost over a certain period.
You calculate churn by dividing the number of customers you lost during the period by the total number of customers you had at the start. You should track customer churn as it reflects customer satisfaction and product-market fit. If customers keep leaving, it's a sign that something's wrong.
The Ideal Benchmark for Customer Churn
The average customer churn rate in SaaS is 5%. If you can bring down the churn rate to less than 3% you’re doing a good job at retaining customers.
Who tracks Customer Churn?
The customer success team keeps an eye on churn to understand and address the reasons why customers might leave. The marketing team uses churn data to refine their campaigns and to understand the customer lifecycle better.
12. Revenue Churn
Revenue churn measures the amount of money a company loses from existing customers over a certain period. This can happen when customers cancel their subscriptions, downgrade their plans, or buy fewer products.
You find your revenue churn by adding up the revenue lost from these customers and dividing it by the total revenue at the start of the period.
This is relevant for SaaS products that offer custom pricing for different customers. In such cases, customer churn doesn’t naturally convey the loss of revenue. Different customers might have different pricing and, therefore, variable revenue churn.
The benchmarks for revenue churn are similar to customer churn, i.e., 5%.
Who Tracks Revenue Churn?
In addition to marketing, success, and leadership teams, finance folks keep a watch on revenue churn as it directly affects the company’s financials.
Numbers Tell a Story
We've seen how each metric, ranging from active trials to revenue churn, fits into a bigger picture. These metrics indicate what your prospects feel about your product, how your message is resonating in the market, whether you need to expand into new markets, scale up or down. Apart from, of course, being crucial data points that drive marketing strategies.
Keep these metrics in check to make your business responsive to market changes and to maximize your ROI on investments.
SaaS Marketing Metrics - Frequently Asked Questions
Q1. What is the rule of 40 in SaaS?
The Rule of 40 helps measure a company's performance and growth efficiency. It states that a company's combined growth rate and profit margin should be at least 40%.
Q2. What is one of the most important metrics in a SaaS model?
In a SaaS (Software as a Service) business model, one of the most critical metrics is often considered to be Monthly Recurring Revenue (MRR) or Annual Recurring Revenue (ARR).
Related Reading
Product Marketing for SaaS: The Ultimate Guide
How to Leverage Attribution Modeling for SaaS Marketing Success
Heading 1
Heading 2
Heading 3
Heading 4
Heading 5
Heading 6
Lorem ipsum dolor sit amet, consectetur adipiscing elit, sed do eiusmod tempor incididunt ut labore et dolore magna aliqua. Ut enim ad minim veniam, quis nostrud exercitation ullamco laboris nisi ut aliquip ex ea commodo consequat. Duis aute irure dolor in reprehenderit in voluptate velit esse cillum dolore eu fugiat nulla pariatur.
Block quote
Ordered list
- Item 1
- Item 2
- Item 3
Unordered list
- Item A
- Item B
- Item C
Bold text
Emphasis
Superscript
Subscript


.svg)

.webp)