Quick summary
This tutorial shows how to visualize MongoDB data inside a Coda doc by creating and configuring a structured table with custom columns, column types, and display options. By following these steps, you can manually encode MongoDB records into Coda and format them to match your preferred data layout.
Steps
- Inside your Coda doc, find and click the Insert button.
- Choose Table from the list of options.
- Enter a unique table name in the input field, then use the floating bar to adjust the table style.
- Double-click each column header cell to edit the label and type your preferred column titles.
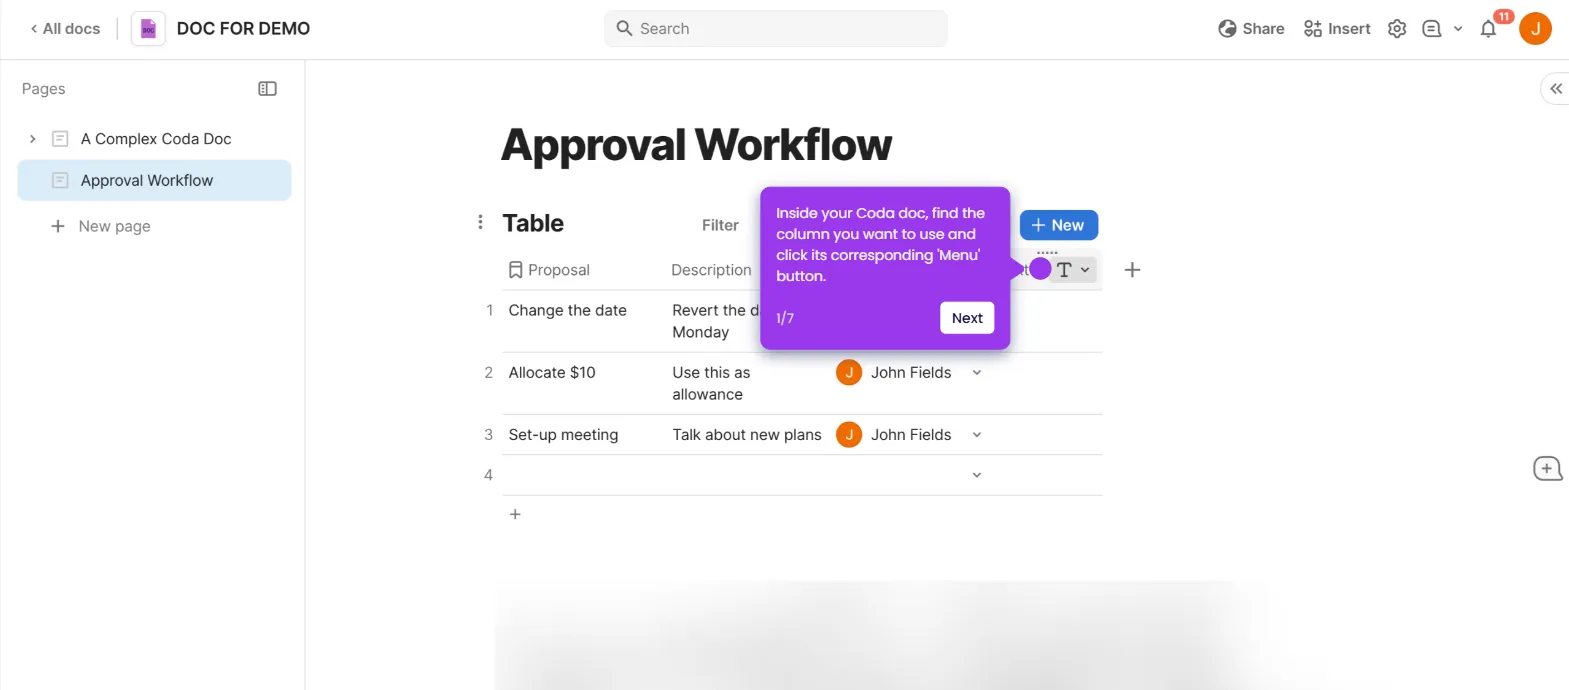
- To change a column type, tap the drop-down arrow next to the table.
- Hover over Column Type and select your preferred column type option.
- Click each cell and manually type the corresponding MongoDB data to populate the table.
- Click the Options button to proceed with further customization.
- Choose your preferred display format and configure its settings to match your preference.
- After completing all steps, your MongoDB data will be fully visualized as a Coda table.