Here’s how to do it:
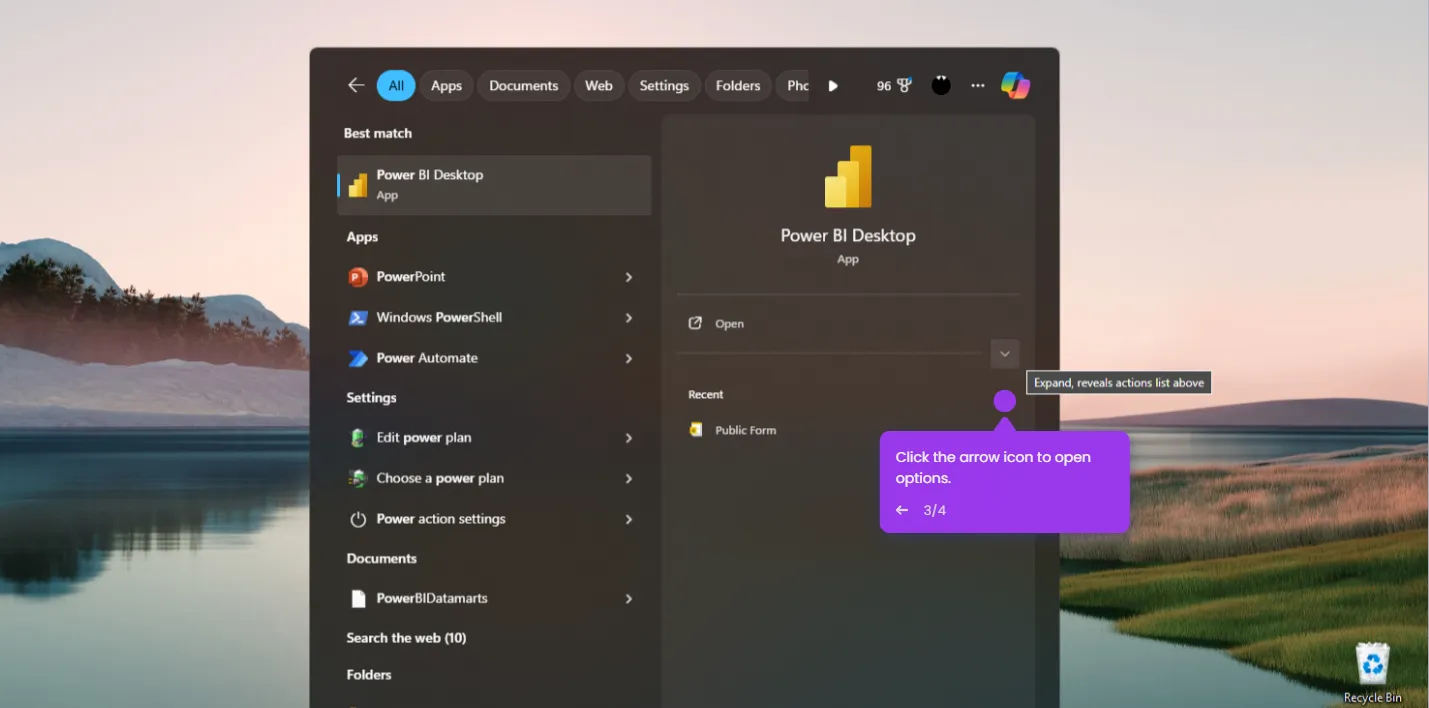
- Open your Power BI desktop and navigate to the report you want to add date filtering to.
- In the 'Visualizations' pane on the right side, look for and click on the 'Slicer' visual icon.
- Find your 'Date' field in the 'Fields' pane and drag it into the empty slicer you just created.
- Power BI will automatically display this as a 'Date Range' slicer.
- You can now filter your report data by selecting specific dates or ranges. The visualizations will update automatically to reflect your date selections.

.svg)
.svg)
.png)


